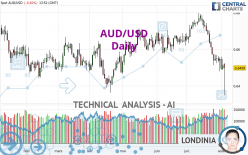
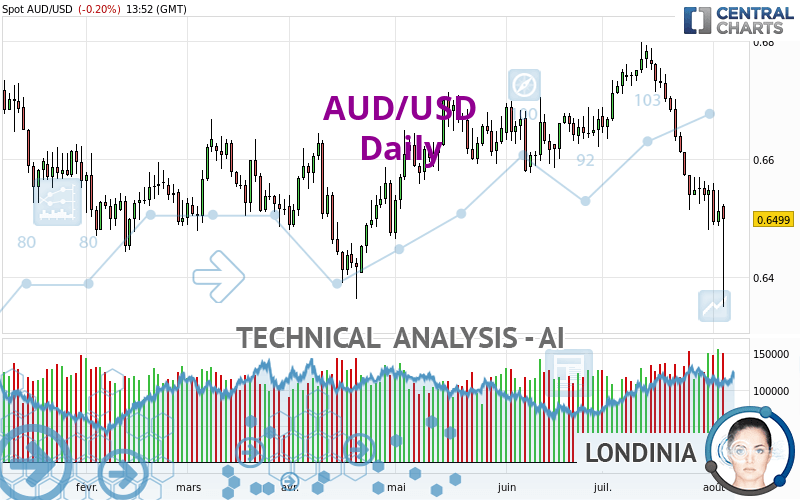
AUD/USD - Daily - Technical analysis published on 08/05/2024 (GMT)
- 113
- 0
Click here for a new analysis!
- Timeframe : Daily
- - Analysis generated on
- Status : INVALID
Summary of the analysis

Additional analysis
Quotes
AUD/USD rating 0.6499 USD. The price registered a decrease of -0.20% on the session and was between 0.6349 USD and 0.6524 USD. This implies that the price is at +2.36% from its lowest and at -0.38% from its highest.A bullish opening was detected by the Central Gaps scanner. Buyers are trying to impose a bullish momentum in the very short term.
Bullish opening
Type : Bullish
Timeframe : Openning
So that you have an overall view of the price change, here is a table showing the variations over several periods:
Near a new LOW record (1 year)
Type : Bearish
Timeframe : Weekly
Near a new HIGH record (1st january)
Type : Bullish
Timeframe : Weekly
New LOW record (1st january)
Type : Bearish
Timeframe : Weekly
Near a new HIGH record (1 month)
Type : Bullish
Timeframe : Weekly
New LOW record (1 month)
Type : Bearish
Timeframe : Weekly
Technical
Technical analysis of AUD/USD in Daily shows a overall strongly bearish trend. 82.14% of the signals given by moving averages are bearish. The overall trend is supported by the strong bearish signals from short-term moving averages. The Central Indicators scanner does not detect any result on moving averages that would impact this trend.
Technical indicators are bearish. There is still some doubt about the decline in the price.
Caution: the Central Indicators scanner currently detects an excess:
RSI indicator is oversold : under 30
Type : Neutral
Timeframe : Daily
CCI indicator is oversold : under -100
Type : Neutral
Timeframe : Daily
Price is back under the pivot point
Type : Bearish
Timeframe : Daily
The Central Patterns scanner, which studies chart patterns, resistances and supports, has identified these signals:
Horizontal support is broken
Type : Bearish
Timeframe : Daily
Support of channel is broken
Type : Bearish
Timeframe : Daily
The presence of these bearish patterns in Japanese candlesticks detected by Central Candlesticks that could cause a correction in the very short term were also noted
Long black line
Type : Bearish
Timeframe : Daily
Bearish engulfing lines
Type : Bearish
Timeframe : Daily
| S3 | S2 | S1 | Price | R1 | R2 | R3 | |
|---|---|---|---|---|---|---|---|
| ProTrendLines | 0.6412 | 0.6453 | 0.6494 | 0.6499 | 0.6632 | 0.6700 | 0.6784 |
| Change (%) | -1.34% | -0.71% | -0.08% | - | +2.05% | +3.09% | +4.39% |
| Change | -0.0087 | -0.0046 | -0.0005 | - | +0.0133 | +0.0201 | +0.0285 |
| Level | Intermediate | Intermediate | Intermediate | - | Intermediate | Minor | Intermediate |
Attention could also be paid to pivot points to set price objectives:
| Pivot points | S3 | S2 | S1 | PP | R1 | R2 | R3 |
|---|---|---|---|---|---|---|---|
| Standard | 0.6421 | 0.6453 | 0.6483 | 0.6515 | 0.6545 | 0.6577 | 0.6607 |
| Camarilla | 0.6495 | 0.6501 | 0.6506 | 0.6512 | 0.6518 | 0.6523 | 0.6529 |
| Woodie | 0.6419 | 0.6453 | 0.6481 | 0.6515 | 0.6543 | 0.6577 | 0.6605 |
| Fibonacci | 0.6453 | 0.6477 | 0.6492 | 0.6515 | 0.6539 | 0.6554 | 0.6577 |
| Pivot points | S3 | S2 | S1 | PP | R1 | R2 | R3 |
|---|---|---|---|---|---|---|---|
| Standard | 0.6381 | 0.6430 | 0.6471 | 0.6520 | 0.6561 | 0.6610 | 0.6651 |
| Camarilla | 0.6487 | 0.6496 | 0.6504 | 0.6512 | 0.6520 | 0.6529 | 0.6537 |
| Woodie | 0.6377 | 0.6428 | 0.6467 | 0.6518 | 0.6557 | 0.6608 | 0.6647 |
| Fibonacci | 0.6430 | 0.6464 | 0.6486 | 0.6520 | 0.6554 | 0.6576 | 0.6610 |
| Pivot points | S3 | S2 | S1 | PP | R1 | R2 | R3 |
|---|---|---|---|---|---|---|---|
| Standard | 0.6098 | 0.6289 | 0.6418 | 0.6609 | 0.6738 | 0.6929 | 0.7058 |
| Camarilla | 0.6460 | 0.6489 | 0.6519 | 0.6548 | 0.6577 | 0.6607 | 0.6636 |
| Woodie | 0.6068 | 0.6274 | 0.6388 | 0.6594 | 0.6708 | 0.6914 | 0.7028 |
| Fibonacci | 0.6289 | 0.6411 | 0.6486 | 0.6609 | 0.6731 | 0.6806 | 0.6929 |
Numerical data
The following is the status of technical indicators and moving averages registered at the time this technical analysis was created:
| RSI (14): | 26.61 | |
| MACD (12,26,9): | -0.0048 | |
| Directional Movement: | -34.3036 | |
| AROON (14): | -100.0000 | |
| DEMA (21): | 0.6543 | |
| Parabolic SAR (0,02-0,02-0,2): | 0.6591 | |
| Elder Ray (13): | -0.0131 | |
| Super Trend (3,10): | 0.6623 | |
| Zig ZAG (10): | 0.6492 | |
| VORTEX (21): | 0.6607 | |
| Stochastique (14,3,5): | 16.79 | |
| TEMA (21): | 0.6495 | |
| Williams %R (14): | -65.27 | |
| Chande Momentum Oscillator (20): | -0.0214 | |
| Repulse (5,40,3): | 0.4198 | |
| ROCnROLL: | 2 | |
| TRIX (15,9): | -0.0616 | |
| Courbe Coppock: | 6.43 |
| MA7: | 0.6526 | |
| MA20: | 0.6634 | |
| MA50: | 0.6647 | |
| MA100: | 0.6602 | |
| MAexp7: | 0.6529 | |
| MAexp20: | 0.6595 | |
| MAexp50: | 0.6625 | |
| MAexp100: | 0.6611 | |
| Price / MA7: | -0.41% | |
| Price / MA20: | -2.03% | |
| Price / MA50: | -2.23% | |
| Price / MA100: | -1.56% | |
| Price / MAexp7: | -0.46% | |
| Price / MAexp20: | -1.46% | |
| Price / MAexp50: | -1.90% | |
| Price / MAexp100: | -1.69% |
News
Don't forget to follow the news on AUD/USD. At the time of publication of this analysis, the latest news was as follows:
-
 AUD/USD Long Term Forecast and Technical Analysis for August 02, 2024, by Chris Lewis for FX Empire
-
AUD/USD Daily Forecast and Technical Analysis for July 30, 2024, by Chris Lewis for FX Empire
-
AUD/USD Daily Forecast and Technical Analysis for July 29, 2024, by Chris Lewis for FX Empire
-
AUD/USD Daily Forecast and Technical Analysis for July 26, 2024, by Chris Lewis for FX Empire
-
AUD/USD Daily Forecast and Technical Analysis for July 25, 2024, by Chris Lewis for FX Empire
About author

Online


Add a comment
Comments
0 comments on the analysis AUD/USD - Daily