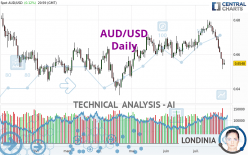
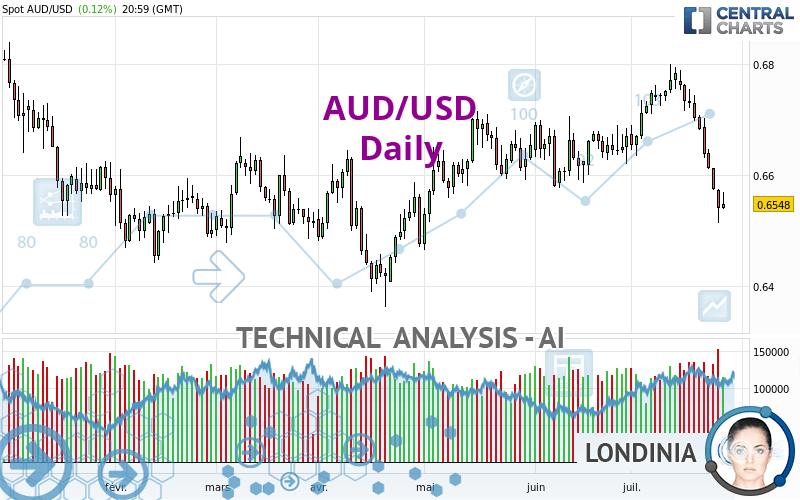
AUD/USD - Daily - Technical analysis published on 07/27/2024 (GMT)
- 131
- 0
Click here for a new analysis!
- Timeframe : Daily
- - Analysis generated on
- Status : TARGET REACHED
Summary of the analysis

Additional analysis
Quotes
The AUD/USD price is 0.6548 USD. The price registered an increase of +0.12% on the session with the lowest point at 0.6539 USD and the highest point at 0.6569 USD. The deviation from the price is +0.14% for the low point and -0.32% for the high point.Here is a more detailed summary of the historical variations registered by AUD/USD:
Near a new HIGH record (1 year)
Type : Bullish
Timeframe : Weekly
Near a new HIGH record (1st january)
Type : Bullish
Timeframe : Weekly
Near a new HIGH record (1 month)
Type : Bullish
Timeframe : Weekly
Technical
A technical analysis in Daily of this AUD/USD chart shows a bearish trend. 71.43% of the signals given by moving averages are bearish. The overall trend is reinforced by the strong bearish signals from short-term moving averages. An assessment of moving averages reveals a bearish signal that could impact this trend:
Bearish trend reversal : Moving Average 100
Type : Bearish
Timeframe : Daily
An assessment of technical indicators does not currently provide any relevant information to suggest whether the signal given by the technical indicators is more bullish or bearish.
Caution: the Central Indicators scanner currently detects an excess:
RSI indicator is oversold : under 30
Type : Neutral
Timeframe : Daily
CCI indicator is oversold : under -100
Type : Neutral
Timeframe : Daily
Previous candle closed under Bollinger bands
Type : Neutral
Timeframe : Daily
Williams %R indicator is oversold : under -80
Type : Neutral
Timeframe : Daily
Pivot points : price is under support 3
Type : Neutral
Timeframe : Weekly
Price is back over the pivot point
Type : Bullish
Timeframe : Daily
The Central Patterns scanner, which studies chart patterns, resistances and supports, has identified these signals:
Near horizontal support
Type : Bullish
Timeframe : Daily
Support of channel is broken
Type : Bearish
Timeframe : Daily
The Central Candlesticks scanner which studies Japanese candlesticks did not detect anything.
| S3 | S2 | S1 | Price | R1 | R2 | R3 | |
|---|---|---|---|---|---|---|---|
| ProTrendLines | 0.6294 | 0.6361 | 0.6453 | 0.6548 | 0.6632 | 0.6700 | 0.6784 |
| Change (%) | -3.88% | -2.86% | -1.45% | - | +1.28% | +2.32% | +3.60% |
| Change | -0.0254 | -0.0187 | -0.0095 | - | +0.0084 | +0.0152 | +0.0236 |
| Level | Major | Minor | Major | - | Intermediate | Major | Minor |
Pivot points can also be used to set your price objectives. Here is the price situation in relation to pivot points:
| Pivot points | S3 | S2 | S1 | PP | R1 | R2 | R3 |
|---|---|---|---|---|---|---|---|
| Standard | 0.6505 | 0.6522 | 0.6535 | 0.6552 | 0.6565 | 0.6582 | 0.6595 |
| Camarilla | 0.6540 | 0.6543 | 0.6545 | 0.6548 | 0.6551 | 0.6554 | 0.6556 |
| Woodie | 0.6503 | 0.6521 | 0.6533 | 0.6551 | 0.6563 | 0.6581 | 0.6593 |
| Fibonacci | 0.6522 | 0.6534 | 0.6541 | 0.6552 | 0.6564 | 0.6571 | 0.6582 |
| Pivot points | S3 | S2 | S1 | PP | R1 | R2 | R3 |
|---|---|---|---|---|---|---|---|
| Standard | 0.6285 | 0.6399 | 0.6474 | 0.6588 | 0.6663 | 0.6777 | 0.6852 |
| Camarilla | 0.6496 | 0.6513 | 0.6531 | 0.6548 | 0.6565 | 0.6583 | 0.6600 |
| Woodie | 0.6265 | 0.6389 | 0.6454 | 0.6578 | 0.6643 | 0.6767 | 0.6832 |
| Fibonacci | 0.6399 | 0.6472 | 0.6516 | 0.6588 | 0.6661 | 0.6705 | 0.6777 |
| Pivot points | S3 | S2 | S1 | PP | R1 | R2 | R3 |
|---|---|---|---|---|---|---|---|
| Standard | 0.6466 | 0.6521 | 0.6595 | 0.6650 | 0.6724 | 0.6779 | 0.6853 |
| Camarilla | 0.6634 | 0.6645 | 0.6657 | 0.6669 | 0.6681 | 0.6693 | 0.6705 |
| Woodie | 0.6476 | 0.6526 | 0.6605 | 0.6655 | 0.6734 | 0.6784 | 0.6863 |
| Fibonacci | 0.6521 | 0.6570 | 0.6601 | 0.6650 | 0.6699 | 0.6730 | 0.6779 |
Numerical data
The following is the status of technical indicators and moving averages registered at the time this technical analysis was created:
| RSI (14): | 29.94 | |
| MACD (12,26,9): | -0.0024 | |
| Directional Movement: | -22.9372 | |
| AROON (14): | -71.4285 | |
| DEMA (21): | 0.6640 | |
| Parabolic SAR (0,02-0,02-0,2): | 0.6721 | |
| Elder Ray (13): | -0.0088 | |
| Super Trend (3,10): | 0.6676 | |
| Zig ZAG (10): | 0.6548 | |
| VORTEX (21): | 0.8852 | |
| Stochastique (14,3,5): | 7.31 | |
| TEMA (21): | 0.6601 | |
| Williams %R (14): | -88.07 | |
| Chande Momentum Oscillator (20): | -0.0203 | |
| Repulse (5,40,3): | -1.1758 | |
| ROCnROLL: | 2 | |
| TRIX (15,9): | 0.0102 | |
| Courbe Coppock: | 3.21 |
| MA7: | 0.6614 | |
| MA20: | 0.6691 | |
| MA50: | 0.6662 | |
| MA100: | 0.6606 | |
| MAexp7: | 0.6605 | |
| MAexp20: | 0.6658 | |
| MAexp50: | 0.6653 | |
| MAexp100: | 0.6624 | |
| Price / MA7: | -1.00% | |
| Price / MA20: | -2.14% | |
| Price / MA50: | -1.71% | |
| Price / MA100: | -0.88% | |
| Price / MAexp7: | -0.86% | |
| Price / MAexp20: | -1.65% | |
| Price / MAexp50: | -1.58% | |
| Price / MAexp100: | -1.15% |
News
The latest news and videos published on AUD/USD at the time of the analysis were as follows:
-
 AUD/USD Daily Forecast and Technical Analysis for July 26, 2024, by Chris Lewis for FX Empire
-
AUD/USD Daily Forecast and Technical Analysis for July 25, 2024, by Chris Lewis for FX Empire
-
AUD/USD Forecast July 25, 2024
-
AUD/USD Daily Forecast and Technical Analysis for July 24, 2024, by Chris Lewis for FX Empire
-
AUD/USD Daily Forecast and Technical Analysis for July 23, 2024, by Chris Lewis for FX Empire
About author

Online


Add a comment
Comments
0 comments on the analysis AUD/USD - Daily