| Open: | - |
| Change: | - |
| Volume: | - |
| Low: | - |
| High: | - |
| High / Low range: | - |
| Type: | Forex |
| Ticker: | AUDNZD |
| ISIN: |
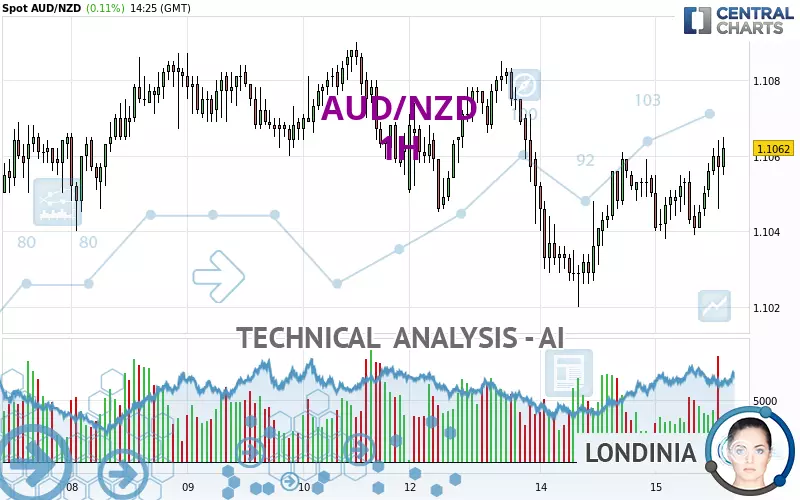
AUD/NZD - 1H - Technical analysis published on 01/15/2025 (GMT)
- 136
- 0
- 01/15/2025 - 14:25
Click here for a new analysis!
- Timeframe : 1H
- - Analysis generated on 01/15/2025 - 14:25
- Status : TARGET REACHED
Summary of the analysis

Additional analysis
Quotes
The AUD/NZD price is 1.1062 NZD. The price registered an increase of +0.11% on the session and was traded between 1.1038 NZD and 1.1065 NZD over the period. The price is currently at +0.22% from its lowest and -0.03% from its highest.So that you have an overall view of the price change, here is a table showing the variations over several periods:
Near a new HIGH record (5 years)
Type : Bullish
Timeframe : Weekly
Near a new LOW record (1 year)
Type : Bearish
Timeframe : Weekly
Near a new HIGH record (1st january)
Type : Bullish
Timeframe : Weekly
Near a new HIGH record (1 month)
Type : Bullish
Timeframe : Weekly
Technical
Technical analysis of this 1H chart of AUD/NZD indicates that the overall trend is slightly bullish. Only 53.57% of the signals given by moving averages are bullish. This slightly bullish trend is reinforced by the strong signals currently being given by short-term moving averages. The Central Indicators market scanner is currently detecting a bullish signal that could impact this trend:
Bullish price crossover with Moving Average 100
Type : Bullish
Timeframe : 1 hour
An assessment of technical indicators shows a strong bullish signal.
Caution: the Central Indicators scanner currently detects an excess:
CCI indicator is overbought : over 100
Type : Neutral
Timeframe : 1 hour
Williams %R indicator is overbought : over -20
Type : Neutral
Timeframe : 1 hour
An analysis of the price chart with the Central Patterns scanner (detector of chart patterns and resistances and supports) shows a result that can have an impact on the price change:
Near resistance of channel
Type : Bearish
Timeframe : 1 hour
No result was found by the Central Candlesticks scanner on Japanese candlesticks.
| S3 | S2 | S1 | Price | R1 | R2 | R3 | |
|---|---|---|---|---|---|---|---|
| ProTrendLines | 1.1020 | 1.1027 | 1.1040 | 1.1062 | 1.1067 | 1.1082 | 1.1101 |
| Change (%) | -0.38% | -0.32% | -0.20% | - | +0.05% | +0.18% | +0.35% |
| Change | -0.0042 | -0.0035 | -0.0022 | - | +0.0005 | +0.0020 | +0.0039 |
| Level | Intermediate | Major | Intermediate | - | Minor | Intermediate | Minor |
Pivot points can also be used to set your price objectives. Here is the price situation in relation to pivot points:
| Pivot points | S3 | S2 | S1 | PP | R1 | R2 | R3 |
|---|---|---|---|---|---|---|---|
| Standard | 1.0985 | 1.1003 | 1.1026 | 1.1044 | 1.1067 | 1.1085 | 1.1108 |
| Camarilla | 1.1039 | 1.1043 | 1.1046 | 1.1050 | 1.1054 | 1.1058 | 1.1061 |
| Woodie | 1.0989 | 1.1004 | 1.1030 | 1.1045 | 1.1071 | 1.1086 | 1.1112 |
| Fibonacci | 1.1003 | 1.1018 | 1.1028 | 1.1044 | 1.1059 | 1.1069 | 1.1085 |
| Pivot points | S3 | S2 | S1 | PP | R1 | R2 | R3 |
|---|---|---|---|---|---|---|---|
| Standard | 1.0988 | 1.1014 | 1.1038 | 1.1064 | 1.1088 | 1.1114 | 1.1138 |
| Camarilla | 1.1048 | 1.1053 | 1.1057 | 1.1062 | 1.1067 | 1.1071 | 1.1076 |
| Woodie | 1.0987 | 1.1014 | 1.1037 | 1.1064 | 1.1087 | 1.1114 | 1.1137 |
| Fibonacci | 1.1014 | 1.1033 | 1.1045 | 1.1064 | 1.1083 | 1.1095 | 1.1114 |
| Pivot points | S3 | S2 | S1 | PP | R1 | R2 | R3 |
|---|---|---|---|---|---|---|---|
| Standard | 1.0763 | 1.0852 | 1.0958 | 1.1047 | 1.1153 | 1.1242 | 1.1348 |
| Camarilla | 1.1009 | 1.1027 | 1.1045 | 1.1063 | 1.1081 | 1.1099 | 1.1117 |
| Woodie | 1.0771 | 1.0856 | 1.0966 | 1.1051 | 1.1161 | 1.1246 | 1.1356 |
| Fibonacci | 1.0852 | 1.0927 | 1.0973 | 1.1047 | 1.1122 | 1.1168 | 1.1242 |
Numerical data
The following is the status of the technical indicators and moving averages at the time of publication of this technical analysis:
| RSI (14): | 61.70 | |
| MACD (12,26,9): | 0.0002 | |
| Directional Movement: | 2.0576 | |
| AROON (14): | 78.5714 | |
| DEMA (21): | 1.1052 | |
| Parabolic SAR (0,02-0,02-0,2): | 1.1041 | |
| Elder Ray (13): | 0.0002 | |
| Super Trend (3,10): | 1.1033 | |
| Zig ZAG (10): | 1.1061 | |
| VORTEX (21): | 1.0000 | |
| Stochastique (14,3,5): | 89.90 | |
| TEMA (21): | 1.1056 | |
| Williams %R (14): | -7.69 | |
| Chande Momentum Oscillator (20): | 0.0020 | |
| Repulse (5,40,3): | 0.0646 | |
| ROCnROLL: | 1 | |
| TRIX (15,9): | 0.0004 | |
| Courbe Coppock: | 0.09 |
| MA7: | 1.1062 | |
| MA20: | 1.1057 | |
| MA50: | 1.1044 | |
| MA100: | 1.0997 | |
| MAexp7: | 1.1056 | |
| MAexp20: | 1.1051 | |
| MAexp50: | 1.1052 | |
| MAexp100: | 1.1057 | |
| Price / MA7: | -0% | |
| Price / MA20: | +0.05% | |
| Price / MA50: | +0.16% | |
| Price / MA100: | +0.59% | |
| Price / MAexp7: | +0.05% | |
| Price / MAexp20: | +0.10% | |
| Price / MAexp50: | +0.09% | |
| Price / MAexp100: | +0.05% |
News
The last news published on AUD/NZD at the time of the generation of this analysis was as follows:
-
02/25/2024 - 06:30
 Trading volatility: AUD/NZD on RBNZ rate decision
-
05/02/2023 - 19:00
Trade of the Week: long AUD/NZD
-
04/18/2023 - 09:00
#AUDNZD at six-week high as RBA considers raising rates...
-
03/08/2023 - 13:20
Trading the Trend: short AUD/NZD
-
03/17/2020 - 07:22
Australian Dollar Analysis: AUD/USD and AUD/NZD May Bounce Before Selloff Resumes
About author

Online


Add a comment
Comments
0 comments on the analysis AUD/NZD - 1H