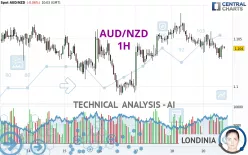
AUD/NZD - 1H - Technical analysis published on 10/21/2024 (GMT)
- 112
- 0
- Timeframe : 1H
- - Analysis generated on
- Status : NEUTRAL

Summary of the analysis

Additional analysis
Quotes
AUD/NZD rating 1.1040 NZD. The price registered a decrease of -0.06% on the session and was between 1.1029 NZD and 11,044.0996 NZD. This implies that the price is at +0.10% from its lowest and at -99.99% from its highest.The Central Gaps scanner detects a bearish opening marking the presence of sellers ahead of buyers at the opening but not sufficiently marked to allow the price to register a quotation gap.
Bearish opening
Type : Bearish
Timeframe : Openning
A study of price movements over other periods shows the following variations:
New HIGH record (5 years)
Type : Bullish
Timeframe : Weekly
New HIGH record (1 year)
Type : Bullish
Timeframe : Weekly
New HIGH record (1st january)
Type : Bullish
Timeframe : Weekly
New HIGH record (1 month)
Type : Bullish
Timeframe : Weekly
Technical
A technical analysis in 1H of this AUD/NZD chart shows a slightly bullish trend. Only 46.43% of the signals given by moving averages are bullish. This slightly bullish trend could turn neutral or reverse given the slightly bearish signals currently being given by short-term moving averages. The Central Indicators scanner does not detect any result on moving averages that would impact this trend.
On the 18 technical indicators analysed, 4 are bullish, 6 are neutral and 8 are bearish. Caution: the Central Indicators scanner currently detects an excess:
Williams %R indicator is oversold : under -80
Type : Neutral
Timeframe : 1 hour
The Central Patterns scanner, which studies chart patterns, resistances and supports, has identified these signals:
Near horizontal support
Type : Bullish
Timeframe : 1 hour
Support of channel is broken
Type : Bearish
Timeframe : 1 hour
No result was found by the Central Candlesticks scanner on Japanese candlesticks.
| S3 | S2 | S1 | Price | R1 | R2 | R3 | |
|---|---|---|---|---|---|---|---|
| ProTrendLines | 1.0991 | 1.1008 | 1.1028 | 1.1040 | 1.1044 | 1.1065 | 1.1077 |
| Change (%) | -0.44% | -0.29% | -0.11% | - | +0.04% | +0.23% | +0.34% |
| Change | -0.0049 | -0.0032 | -0.0012 | - | +0.0004 | +0.0025 | +0.0037 |
| Level | Intermediate | Minor | Minor | - | Major | Minor | Intermediate |
Attention could also be paid to pivot points to set price objectives:
| Pivot points | S3 | S2 | S1 | PP | R1 | R2 | R3 |
|---|---|---|---|---|---|---|---|
| Standard | 1.0994 | 1.1016 | 1.1032 | 1.1054 | 1.1070 | 1.1092 | 1.1108 |
| Camarilla | 1.1037 | 1.1040 | 1.1044 | 1.1047 | 1.1051 | 1.1054 | 1.1058 |
| Woodie | 1.0990 | 1.1015 | 1.1028 | 1.1053 | 1.1066 | 1.1091 | 1.1104 |
| Fibonacci | 1.1016 | 1.1031 | 1.1040 | 1.1054 | 1.1069 | 1.1078 | 1.1092 |
| Pivot points | S3 | S2 | S1 | PP | R1 | R2 | R3 |
|---|---|---|---|---|---|---|---|
| Standard | 1.0914 | 1.0952 | 1.1000 | 1.1038 | 1.1086 | 1.1124 | 1.1172 |
| Camarilla | 1.1023 | 1.1031 | 1.1039 | 1.1047 | 1.1055 | 1.1063 | 1.1071 |
| Woodie | 1.0918 | 1.0955 | 1.1004 | 1.1041 | 1.1090 | 1.1127 | 1.1176 |
| Fibonacci | 1.0952 | 1.0985 | 1.1006 | 1.1038 | 1.1071 | 1.1092 | 1.1124 |
| Pivot points | S3 | S2 | S1 | PP | R1 | R2 | R3 |
|---|---|---|---|---|---|---|---|
| Standard | 1.0641 | 1.0711 | 1.0805 | 1.0875 | 1.0969 | 1.1039 | 1.1133 |
| Camarilla | 1.0854 | 1.0869 | 1.0884 | 1.0899 | 1.0914 | 1.0929 | 1.0944 |
| Woodie | 1.0653 | 1.0717 | 1.0817 | 1.0881 | 1.0981 | 1.1045 | 1.1145 |
| Fibonacci | 1.0711 | 1.0774 | 1.0812 | 1.0875 | 1.0938 | 1.0976 | 1.1039 |
Numerical data
The following are the details of the technical indicators and moving averages that were collected to generate this technical analysis:
| RSI (14): | 47.62 | |
| MACD (12,26,9): | -0.0003 | |
| Directional Movement: | 99.9997 | |
| AROON (14): | -78.5714 | |
| DEMA (21): | 1.1041 | |
| Parabolic SAR (0,02-0,02-0,2): | 6,850.6710 | |
| Elder Ray (13): | -0.0001 | |
| Super Trend (3,10): | 843.2013 | |
| Zig ZAG (10): | 1.1041 | |
| VORTEX (21): | 1.0000 | |
| Stochastique (14,3,5): | 0.00 | |
| TEMA (21): | 1.1037 | |
| Williams %R (14): | -100.00 | |
| Chande Momentum Oscillator (20): | -0.0005 | |
| Repulse (5,40,3): | -3,424.8042 | |
| ROCnROLL: | -1 | |
| TRIX (15,9): | -0.0029 | |
| Courbe Coppock: | 0.13 |
| MA7: | 1.1038 | |
| MA20: | 1.0993 | |
| MA50: | 1.0937 | |
| MA100: | 1.0945 | |
| MAexp7: | 1.1040 | |
| MAexp20: | 1.1044 | |
| MAexp50: | 1.1044 | |
| MAexp100: | 1.1041 | |
| Price / MA7: | +0.02% | |
| Price / MA20: | +0.43% | |
| Price / MA50: | +0.94% | |
| Price / MA100: | +0.87% | |
| Price / MAexp7: | -0% | |
| Price / MAexp20: | -0.04% | |
| Price / MAexp50: | -0.04% | |
| Price / MAexp100: | -0.01% |
News
The latest news and videos published on AUD/NZD at the time of the analysis were as follows:
-
 Trading volatility: AUD/NZD on RBNZ rate decision
-
Trade of the Week: long AUD/NZD
-
#AUDNZD at six-week high as RBA considers raising rates...
-
Trading the Trend: short AUD/NZD
-
Australian Dollar Analysis: AUD/USD and AUD/NZD May Bounce Before Selloff Resumes
About author

Online


Add a comment
Comments
0 comments on the analysis AUD/NZD - 1H