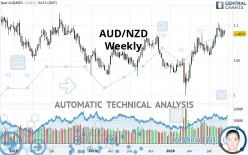
AUD/NZD - Weekly - Technical analysis published on 09/16/2020 (GMT)
- 248
- 0
- Who voted?
Click here for a new analysis!
- Timeframe : Weekly
- - Analysis generated on
- Status : LEVEL MAINTAINED

Summary of the analysis

Additional analysis
Quotes
AUD/NZD rating 1.0875 NZD. The price is lower by -0.16% over the 5 days with the lowest point at 1.0857 NZD and the highest point at 1.0933 NZD. The deviation from the price is +0.17% for the low point and -0.53% for the high point.Here is a more detailed summary of the historical variations registered by AUD/NZD:
Near a new HIGH record (5 years)
Type : Bullish
Timeframe : Weekly
Near a new HIGH record (1st january)
Type : Bullish
Timeframe : Weekly
Technical
Technical analysis of AUD/NZD in Weekly shows a strongly overall bullish trend. 92.86% of the signals given by moving averages are bullish. This strongly bullish trend is supported by the strong bullish signals given by short-term moving averages. The Central Indicators scanner does not detect any result on moving averages that would impact this trend.
The probability of a further increase is high given the direction of the technical indicators.
Caution: the Central Indicators scanner currently detects an excess:
CCI indicator is overbought : over 100
Type : Neutral
Timeframe : Weekly
Williams %R indicator is overbought : over -20
Type : Neutral
Timeframe : Weekly
Price is back over the pivot point
Type : Bullish
Timeframe : Weekly
An analysis of the price chart with the Central Patterns scanner (detector of chart patterns and resistances and supports) shows a result that can have an impact on the price change:
Near resistance of channel
Type : Bearish
Timeframe : Weekly
The presence of a bullish Japanese candlestick pattern detected by Central Candlesticks that could cause a very short term rebound was also detected:
Bullish harami
Type : Bullish
Timeframe : Weekly
| S3 | S2 | S1 | Price | R1 | R2 | R3 | |
|---|---|---|---|---|---|---|---|
| ProTrendLines | 1.0377 | 1.0515 | 1.0831 | 1.0875 | 1.0987 | 1.1159 | 1.1274 |
| Change (%) | -4.58% | -3.31% | -0.40% | - | +1.03% | +2.61% | +3.67% |
| Change | -0.0498 | -0.0360 | -0.0044 | - | +0.0112 | +0.0284 | +0.0399 |
| Level | Minor | Intermediate | Major | - | Intermediate | Intermediate | Intermediate |
Pivot points can also be used to set your price objectives. Here is the price situation in relation to pivot points:
| Pivot points | S3 | S2 | S1 | PP | R1 | R2 | R3 |
|---|---|---|---|---|---|---|---|
| Standard | 1.0800 | 1.0829 | 1.0852 | 1.0881 | 1.0904 | 1.0933 | 1.0956 |
| Camarilla | 1.0860 | 1.0865 | 1.0869 | 1.0874 | 1.0879 | 1.0884 | 1.0888 |
| Woodie | 1.0796 | 1.0828 | 1.0848 | 1.0880 | 1.0900 | 1.0932 | 1.0952 |
| Fibonacci | 1.0829 | 1.0849 | 1.0862 | 1.0881 | 1.0901 | 1.0914 | 1.0933 |
| Pivot points | S3 | S2 | S1 | PP | R1 | R2 | R3 |
|---|---|---|---|---|---|---|---|
| Standard | 1.0761 | 1.0799 | 1.0861 | 1.0899 | 1.0961 | 1.0999 | 1.1061 |
| Camarilla | 1.0897 | 1.0906 | 1.0915 | 1.0924 | 1.0933 | 1.0942 | 1.0952 |
| Woodie | 1.0774 | 1.0805 | 1.0874 | 1.0905 | 1.0974 | 1.1005 | 1.1074 |
| Fibonacci | 1.0799 | 1.0837 | 1.0861 | 1.0899 | 1.0937 | 1.0961 | 1.0999 |
| Pivot points | S3 | S2 | S1 | PP | R1 | R2 | R3 |
|---|---|---|---|---|---|---|---|
| Standard | 1.0443 | 1.0580 | 1.0769 | 1.0906 | 1.1095 | 1.1232 | 1.1421 |
| Camarilla | 1.0867 | 1.0897 | 1.0927 | 1.0957 | 1.0987 | 1.1017 | 1.1047 |
| Woodie | 1.0468 | 1.0593 | 1.0794 | 1.0919 | 1.1120 | 1.1245 | 1.1446 |
| Fibonacci | 1.0580 | 1.0705 | 1.0782 | 1.0906 | 1.1031 | 1.1108 | 1.1232 |
Numerical data
The following is the status of technical indicators and moving averages registered at the time this technical analysis was created:
| RSI (14): | 59.70 | |
| MACD (12,26,9): | 0.0099 | |
| Directional Movement: | 10.7648 | |
| AROON (14): | 42.8572 | |
| DEMA (21): | 1.0885 | |
| Parabolic SAR (0,02-0,02-0,2): | 1.0688 | |
| Elder Ray (13): | 0.0079 | |
| Super Trend (3,10): | 1.0583 | |
| Zig ZAG (10): | 1.0876 | |
| VORTEX (21): | 1.1380 | |
| Stochastique (14,3,5): | 65.34 | |
| TEMA (21): | 1.0944 | |
| Williams %R (14): | -35.15 | |
| Chande Momentum Oscillator (20): | 0.0186 | |
| Repulse (5,40,3): | -0.0757 | |
| ROCnROLL: | 1 | |
| TRIX (15,9): | 0.1221 | |
| Courbe Coppock: | 3.71 |
| MA7: | 1.0895 | |
| MA20: | 1.0912 | |
| MA50: | 1.0830 | |
| MA100: | 1.0761 | |
| MAexp7: | 1.0869 | |
| MAexp20: | 1.0761 | |
| MAexp50: | 1.0655 | |
| MAexp100: | 1.0636 | |
| Price / MA7: | -0.18% | |
| Price / MA20: | -0.34% | |
| Price / MA50: | +0.42% | |
| Price / MA100: | +1.06% | |
| Price / MAexp7: | +0.06% | |
| Price / MAexp20: | +1.06% | |
| Price / MAexp50: | +2.06% | |
| Price / MAexp100: | +2.25% |
News
Don"t forget to follow the news on AUD/NZD. At the time of publication of this analysis, the latest news was as follows:
-
 Australian Dollar Analysis: AUD/USD and AUD/NZD May Bounce Before Selloff Resumes
-
EURUSD, USDJPY and AUDNZD Absorb ECB, Risk Trends, Key Data
-
Technical Analysis for EUR/USD, USD/CAD, AUD/NZD & More
-
Charts for Next Week – EUR/USD, USD/JPY, AUD/NZD & More
-
Trading Outlook – USD, Euro, Pound, AUD/NZD and More
About author

Online


Add a comment
Comments
0 comments on the analysis AUD/NZD - Weekly