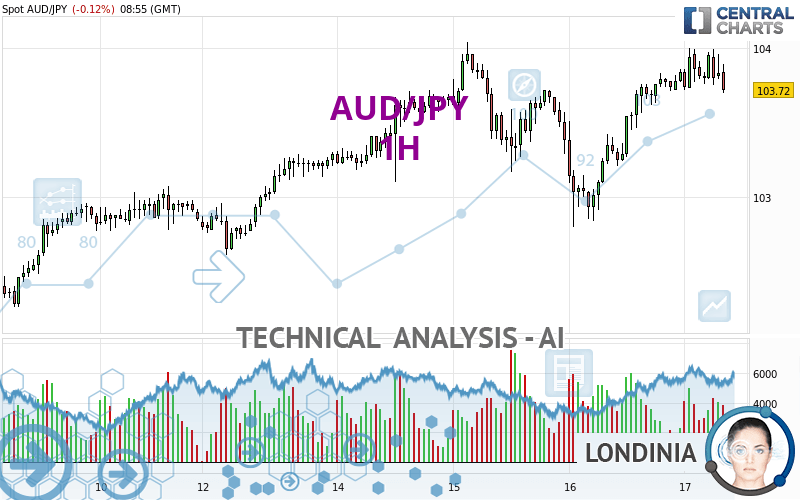
AUD/JPY - 1H - Technical analysis published on 05/17/2024 (GMT)
- 72
- 0
Click here for a new analysis!
- Timeframe : 1H
- - Analysis generated on
- Status : TARGET REACHED

Summary of the analysis

Additional analysis
Quotes
AUD/JPY rating 103.72 JPY. The price registered a decrease of -0.12% on the session with the lowest point at 103.70 JPY and the highest point at 104.00 JPY. The deviation from the price is +0.02% for the low point and -0.27% for the high point.Here is a more detailed summary of the historical variations registered by AUD/JPY:
Near a new HIGH record (5 years)
Type : Bullish
Timeframe : Weekly
Near a new HIGH record (1 year)
Type : Bullish
Timeframe : Weekly
Near a new HIGH record (1st january)
Type : Bullish
Timeframe : Weekly
Near a new HIGH record (1 month)
Type : Bullish
Timeframe : Weekly
Technical
A technical analysis in 1H of this AUD/JPY chart shows a bullish trend. 71.43% of the signals given by moving averages are bullish. Caution: the neutral signals currently given by the short-term moving averages indicate that this bullish trend is showing signs of running out of steam. The Central Indicators scanner detects bearish signals on moving averages that could impact this trend:
Bearish price crossover with Moving Average 20
Type : Bearish
Timeframe : 1 hour
Bearish price crossover with adaptative moving average 20
Type : Bearish
Timeframe : 1 hour
In fact, of the 18 technical indicators analysed by Central Analyzer, 5 are bullish, 7 are neutral and 6 are bearish. But beware of excesses. The Central Indicators scanner currently detects this:
Williams %R indicator is oversold : under -80
Type : Neutral
Timeframe : 1 hour
Pivot points : price is over resistance 1
Type : Neutral
Timeframe : Weekly
Momentum indicator is back under 0
Type : Bearish
Timeframe : 1 hour
The analysis of the price chart with Central Patterns scanners does not return any result.
For a small setback in the very short term, the Central Candlesticks scanner currently notes the presence of this bearish pattern in Japanese candlesticks:
Bearish engulfing lines
Type : Bearish
Timeframe : 1 hour
| S3 | S2 | S1 | R1 | Price | R2 | R3 | |
|---|---|---|---|---|---|---|---|
| ProTrendLines | 102.25 | 102.79 | 103.45 | 103.72 | 103.72 | 104.04 | 105.04 |
| Change (%) | -1.42% | -0.90% | -0.26% | 0% | - | +0.31% | +1.27% |
| Change | -1.47 | -0.93 | -0.27 | 0 | - | +0.32 | +1.32 |
| Level | Minor | Major | Intermediate | Intermediate | - | Intermediate | Intermediate |
Pivot points can also be used to set your price objectives. Here is the price situation in relation to pivot points:
| Pivot points | S3 | S2 | S1 | PP | R1 | R2 | R3 |
|---|---|---|---|---|---|---|---|
| Standard | 102.08 | 102.44 | 103.14 | 103.50 | 104.20 | 104.56 | 105.26 |
| Camarilla | 103.55 | 103.65 | 103.74 | 103.84 | 103.94 | 104.03 | 104.13 |
| Woodie | 102.25 | 102.53 | 103.31 | 103.59 | 104.37 | 104.65 | 105.43 |
| Fibonacci | 102.44 | 102.85 | 103.10 | 103.50 | 103.91 | 104.16 | 104.56 |
| Pivot points | S3 | S2 | S1 | PP | R1 | R2 | R3 |
|---|---|---|---|---|---|---|---|
| Standard | 99.41 | 100.18 | 101.52 | 102.29 | 103.63 | 104.40 | 105.74 |
| Camarilla | 102.27 | 102.46 | 102.66 | 102.85 | 103.04 | 103.24 | 103.43 |
| Woodie | 99.69 | 100.32 | 101.80 | 102.43 | 103.91 | 104.54 | 106.02 |
| Fibonacci | 100.18 | 100.99 | 101.49 | 102.29 | 103.10 | 103.60 | 104.40 |
| Pivot points | S3 | S2 | S1 | PP | R1 | R2 | R3 |
|---|---|---|---|---|---|---|---|
| Standard | 91.12 | 94.45 | 98.30 | 101.63 | 105.48 | 108.81 | 112.66 |
| Camarilla | 100.18 | 100.83 | 101.49 | 102.15 | 102.81 | 103.47 | 104.13 |
| Woodie | 91.38 | 94.58 | 98.56 | 101.76 | 105.74 | 108.94 | 112.92 |
| Fibonacci | 94.45 | 97.19 | 98.89 | 101.63 | 104.37 | 106.07 | 108.81 |
Numerical data
The following are the details of the technical indicators and moving averages that were collected to generate this technical analysis:
| RSI (14): | 52.27 | |
| MACD (12,26,9): | 0.0900 | |
| Directional Movement: | 6.67 | |
| AROON (14): | 50.00 | |
| DEMA (21): | 103.86 | |
| Parabolic SAR (0,02-0,02-0,2): | 103.99 | |
| Elder Ray (13): | 0.01 | |
| Super Trend (3,10): | 103.44 | |
| Zig ZAG (10): | 103.73 | |
| VORTEX (21): | 1.1500 | |
| Stochastique (14,3,5): | 36.11 | |
| TEMA (21): | 103.89 | |
| Williams %R (14): | -96.55 | |
| Chande Momentum Oscillator (20): | -0.05 | |
| Repulse (5,40,3): | -0.2400 | |
| ROCnROLL: | -1 | |
| TRIX (15,9): | 0.0200 | |
| Courbe Coppock: | 0.26 |
| MA7: | 103.37 | |
| MA20: | 102.21 | |
| MA50: | 100.24 | |
| MA100: | 98.81 | |
| MAexp7: | 103.80 | |
| MAexp20: | 103.74 | |
| MAexp50: | 103.60 | |
| MAexp100: | 103.39 | |
| Price / MA7: | +0.34% | |
| Price / MA20: | +1.48% | |
| Price / MA50: | +3.47% | |
| Price / MA100: | +4.97% | |
| Price / MAexp7: | -0.08% | |
| Price / MAexp20: | -0.02% | |
| Price / MAexp50: | +0.12% | |
| Price / MAexp100: | +0.32% |
News
The last news published on AUD/JPY at the time of the generation of this analysis was as follows:
-
 AUD/JPY Forecast January 6, 2023
-
AUD/JPY Forecast December 16, 2022
-
Risk event for the week: Long #AUDJPY
-
Trade of the Week: long AUD/JPY
-
Market Sentiment Webinar: Positive for USD, Bullish Signal on AUD/JPY
About author

Online


Add a comment
Comments
0 comments on the analysis AUD/JPY - 1H