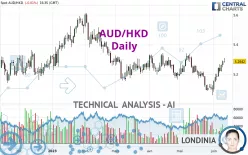
AUD/HKD - Daily - Technical analysis published on 06/12/2023 (GMT)
- 173
- 0
Click here for a new analysis!
- Timeframe : Daily
- - Analysis generated on
- Status : INVALID

Summary of the analysis

Additional analysis
Quotes
The AUD/HKD price is 5.2842 HKD. The price is lower by -0.01% since the last closing and was between 5.2766 HKD and 5.3084 HKD. This implies that the price is at +0.14% from its lowest and at -0.46% from its highest.A bearish opening was detected by the Central Gaps scanner. Sellers are trying to impose a bearish trend in the very short term.
Bearish opening
Type : Bearish
Timeframe : Openning
Here is a more detailed summary of the historical variations registered by AUD/HKD:
Near a new LOW record (1st january)
Type : Bearish
Timeframe : Weekly
Near a new LOW record (1 month)
Type : Bearish
Timeframe : Weekly
Technical
Technical analysis of this Daily chart of AUD/HKD indicates that the overall trend is not clearly defined. The strong bullish signals currently being given by short-term moving averages could allow the overall trend to return to bullish. There is no crossing of moving average by the price or crossing of moving averages between themselves.
In fact, 15 technical indicators on 18 studied are currently bullish. But beware of excesses. The Central Indicators scanner currently detects this:
CCI indicator is overbought : over 100
Type : Neutral
Timeframe : Daily
Williams %R indicator is overbought : over -20
Type : Neutral
Timeframe : Daily
The Central Patterns scanner, which studies chart patterns, resistances and supports, has identified this signal:
Near resistance of channel
Type : Bearish
Timeframe : Daily
The Central Candlesticks scanner, specialised in Japanese candlesticks, did not identify any signals.
| S3 | S2 | S1 | Price | R1 | R2 | R3 | |
|---|---|---|---|---|---|---|---|
| ProTrendLines | 5.0931 | 5.1694 | 5.2515 | 5.2842 | 5.3472 | 5.4081 | 5.4840 |
| Change (%) | -3.62% | -2.17% | -0.62% | - | +1.19% | +2.34% | +3.78% |
| Change | -0.1911 | -0.1148 | -0.0327 | - | +0.0630 | +0.1239 | +0.1998 |
| Level | Major | Major | Intermediate | - | Major | Minor | Minor |
To determine price objectives, it is also possible to use the pivot points. Here is the price position in relation to pivot points:
| Pivot points | S3 | S2 | S1 | PP | R1 | R2 | R3 |
|---|---|---|---|---|---|---|---|
| Standard | 5.2082 | 5.2266 | 5.2555 | 5.2739 | 5.3028 | 5.3212 | 5.3501 |
| Camarilla | 5.2715 | 5.2758 | 5.2802 | 5.2845 | 5.2888 | 5.2932 | 5.2975 |
| Woodie | 5.2136 | 5.2292 | 5.2609 | 5.2765 | 5.3082 | 5.3238 | 5.3555 |
| Fibonacci | 5.2266 | 5.2446 | 5.2558 | 5.2739 | 5.2919 | 5.3031 | 5.3212 |
| Pivot points | S3 | S2 | S1 | PP | R1 | R2 | R3 |
|---|---|---|---|---|---|---|---|
| Standard | 5.0622 | 5.1098 | 5.1971 | 5.2447 | 5.3320 | 5.3796 | 5.4669 |
| Camarilla | 5.2474 | 5.2598 | 5.2721 | 5.2845 | 5.2969 | 5.3092 | 5.3216 |
| Woodie | 5.0822 | 5.1197 | 5.2171 | 5.2546 | 5.3520 | 5.3895 | 5.4869 |
| Fibonacci | 5.1098 | 5.1613 | 5.1931 | 5.2447 | 5.2962 | 5.3280 | 5.3796 |
| Pivot points | S3 | S2 | S1 | PP | R1 | R2 | R3 |
|---|---|---|---|---|---|---|---|
| Standard | 4.7038 | 4.8799 | 4.9875 | 5.1636 | 5.2712 | 5.4473 | 5.5549 |
| Camarilla | 5.0170 | 5.0430 | 5.0690 | 5.0950 | 5.1210 | 5.1470 | 5.1730 |
| Woodie | 4.6695 | 4.8628 | 4.9532 | 5.1465 | 5.2369 | 5.4302 | 5.5206 |
| Fibonacci | 4.8799 | 4.9883 | 5.0553 | 5.1636 | 5.2720 | 5.3390 | 5.4473 |
Numerical data
The following is the status of technical indicators and moving averages registered at the time this technical analysis was created:
| RSI (14): | 61.79 | |
| MACD (12,26,9): | 0.0089 | |
| Directional Movement: | 9.6935 | |
| AROON (14): | 57.1429 | |
| DEMA (21): | 5.2097 | |
| Parabolic SAR (0,02-0,02-0,2): | 5.1235 | |
| Elder Ray (13): | 0.0777 | |
| Super Trend (3,10): | 5.1453 | |
| Zig ZAG (10): | 5.2872 | |
| VORTEX (21): | 1.0685 | |
| Stochastique (14,3,5): | 94.98 | |
| TEMA (21): | 5.2340 | |
| Williams %R (14): | -8.68 | |
| Chande Momentum Oscillator (20): | 0.1953 | |
| Repulse (5,40,3): | 1.0002 | |
| ROCnROLL: | 1 | |
| TRIX (15,9): | -0.0375 | |
| Courbe Coppock: | 2.10 |
| MA7: | 5.2359 | |
| MA20: | 5.1818 | |
| MA50: | 5.2246 | |
| MA100: | 5.2858 | |
| MAexp7: | 5.2395 | |
| MAexp20: | 5.2075 | |
| MAexp50: | 5.2230 | |
| MAexp100: | 5.2514 | |
| Price / MA7: | +0.92% | |
| Price / MA20: | +1.98% | |
| Price / MA50: | +1.14% | |
| Price / MA100: | -0.03% | |
| Price / MAexp7: | +0.85% | |
| Price / MAexp20: | +1.47% | |
| Price / MAexp50: | +1.17% | |
| Price / MAexp100: | +0.62% |
About author
Online


Add a comment
Comments
0 comments on the analysis AUD/HKD - Daily