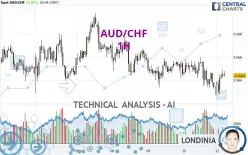
AUD/CHF - 1H - Technical analysis published on 01/13/2025 (GMT)
- 129
- 0
Click here for a new analysis!
- Timeframe : 1H
- - Analysis generated on
- Status : TARGET REACHED

Summary of the analysis

Additional analysis
Quotes
The AUD/CHF rating is 0.5644 CHF. On the day, this instrument gained +0.18% and was between 0.5627 CHF and 0.5649 CHF. This implies that the price is at +0.30% from its lowest and at -0.09% from its highest.The Central Gaps scanner detects a bullish opening. A small advantage for buyers in the very short term.
Bullish opening
Type : Bullish
Timeframe : Openning
A study of price movements over other periods shows the following variations:
Near a new LOW record (1 year)
Type : Bearish
Timeframe : Weekly
Near a new HIGH record (1st january)
Type : Bullish
Timeframe : Weekly
Near a new LOW record (1 month)
Type : Bearish
Timeframe : Weekly
Technical
Technical analysis of AUD/CHF in 1H shows an overall bearish trend. 64.29% of the signals given by moving averages are bearish. Caution: as the signals currently given by short-term moving averages are rather neutral, the bearish trend could slow down. There is no crossing of moving average by the price or crossing of moving averages between themselves.
The probability of a further increase are moderate given the direction of the technical indicators.
But beware of excesses. The Central Indicators scanner currently detects this:
Williams %R indicator is overbought : over -20
Type : Neutral
Timeframe : 1 hour
Momentum indicator is back over 0
Type : Bullish
Timeframe : 1 hour
Central Patterns, the scanner specializing in chart patterns, did not identify any signals.
The Central Candlesticks scanner which studies Japanese candlesticks did not detect anything.
| S3 | S2 | S1 | Price | R1 | R2 | R3 | |
|---|---|---|---|---|---|---|---|
| ProTrendLines | 0.5609 | 0.5629 | 0.5642 | 0.5644 | 0.5660 | 0.5679 | 0.5698 |
| Change (%) | -0.62% | -0.27% | -0.04% | - | +0.28% | +0.62% | +0.96% |
| Change | -0.0035 | -0.0015 | -0.0002 | - | +0.0016 | +0.0035 | +0.0054 |
| Level | Major | Intermediate | Minor | - | Intermediate | Major | Minor |
To determine price objectives, it is also possible to use the pivot points. Here is the price position in relation to pivot points:
| Pivot points | S3 | S2 | S1 | PP | R1 | R2 | R3 |
|---|---|---|---|---|---|---|---|
| Standard | 0.5588 | 0.5607 | 0.5621 | 0.5640 | 0.5654 | 0.5673 | 0.5687 |
| Camarilla | 0.5625 | 0.5628 | 0.5631 | 0.5634 | 0.5637 | 0.5640 | 0.5643 |
| Woodie | 0.5585 | 0.5606 | 0.5618 | 0.5639 | 0.5651 | 0.5672 | 0.5684 |
| Fibonacci | 0.5607 | 0.5620 | 0.5628 | 0.5640 | 0.5653 | 0.5661 | 0.5673 |
| Pivot points | S3 | S2 | S1 | PP | R1 | R2 | R3 |
|---|---|---|---|---|---|---|---|
| Standard | 0.5537 | 0.5582 | 0.5608 | 0.5653 | 0.5679 | 0.5724 | 0.5750 |
| Camarilla | 0.5615 | 0.5621 | 0.5628 | 0.5634 | 0.5641 | 0.5647 | 0.5654 |
| Woodie | 0.5528 | 0.5577 | 0.5599 | 0.5648 | 0.5670 | 0.5719 | 0.5741 |
| Fibonacci | 0.5582 | 0.5609 | 0.5626 | 0.5653 | 0.5680 | 0.5697 | 0.5724 |
| Pivot points | S3 | S2 | S1 | PP | R1 | R2 | R3 |
|---|---|---|---|---|---|---|---|
| Standard | 0.5337 | 0.5451 | 0.5534 | 0.5648 | 0.5731 | 0.5845 | 0.5928 |
| Camarilla | 0.5563 | 0.5581 | 0.5599 | 0.5617 | 0.5635 | 0.5653 | 0.5671 |
| Woodie | 0.5322 | 0.5443 | 0.5519 | 0.5640 | 0.5716 | 0.5837 | 0.5913 |
| Fibonacci | 0.5451 | 0.5526 | 0.5573 | 0.5648 | 0.5723 | 0.5770 | 0.5845 |
Numerical data
The following is the status of technical indicators and moving averages registered at the time this technical analysis was created:
| RSI (14): | 51.01 | |
| MACD (12,26,9): | -0.0002 | |
| Directional Movement: | -0.2242 | |
| AROON (14): | -57.1429 | |
| DEMA (21): | 0.5640 | |
| Parabolic SAR (0,02-0,02-0,2): | 0.5628 | |
| Elder Ray (13): | 0.0004 | |
| Super Trend (3,10): | 0.5657 | |
| Zig ZAG (10): | 0.5643 | |
| VORTEX (21): | 0.9799 | |
| Stochastique (14,3,5): | 66.62 | |
| TEMA (21): | 0.5639 | |
| Williams %R (14): | -21.74 | |
| Chande Momentum Oscillator (20): | 0.0004 | |
| Repulse (5,40,3): | -0.0049 | |
| ROCnROLL: | -1 | |
| TRIX (15,9): | -0.0080 | |
| Courbe Coppock: | 0.27 |
| MA7: | 0.5649 | |
| MA20: | 0.5632 | |
| MA50: | 0.5690 | |
| MA100: | 0.5720 | |
| MAexp7: | 0.5642 | |
| MAexp20: | 0.5643 | |
| MAexp50: | 0.5647 | |
| MAexp100: | 0.5650 | |
| Price / MA7: | -0.09% | |
| Price / MA20: | +0.21% | |
| Price / MA50: | -0.81% | |
| Price / MA100: | -1.33% | |
| Price / MAexp7: | +0.04% | |
| Price / MAexp20: | +0.02% | |
| Price / MAexp50: | -0.05% | |
| Price / MAexp100: | -0.11% |
News
The last news published on AUD/CHF at the time of the generation of this analysis was as follows:
-
 AUD/CHF Forecast November 4, 2024
-
AUD/CHF Forecast October 10, 2024
-
AUD/CHF Forecast September 30, 2024
-
AUD/CHF Forecast September 16, 2024
-
AUD/CHF Forecast August 5, 2024
About author

Online


Add a comment
Comments
0 comments on the analysis AUD/CHF - 1H