| Open: | 524.13 |
| Change: | -2.01 |
| Volume: | 0 |
| Low: | 517.10 |
| High: | 524.14 |
| High / Low range: | 7.04 |
| Type: | Forex |
| Ticker: | AUDCHF |
| ISIN: |
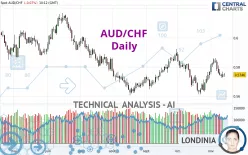
AUD/CHF - Daily - Technical analysis published on 11/14/2023 (GMT)
- 123
- 0
- 11/14/2023 - 10:12
Click here for a new analysis!
- Timeframe : Daily
- - Analysis generated on 11/14/2023 - 10:12
- Status : LEVEL MAINTAINED

Summary of the analysis

Additional analysis
Quotes
The AUD/CHF price is 0.5746 CHF. On the day, this instrument lost -0.07% and was between 0.5733 CHF and 0.5759 CHF. This implies that the price is at +0.23% from its lowest and at -0.23% from its highest.A study of price movements over other periods shows the following variations:
Near a new LOW record (1 year)
Type : Bearish
Timeframe : Weekly
Near a new LOW record (1st january)
Type : Bearish
Timeframe : Weekly
Near a new LOW record (1 month)
Type : Bearish
Timeframe : Weekly
Technical
Technical analysis of AUD/CHF in Daily shows an overall bearish trend. 75.00% of the signals given by moving averages are bearish. Caution: the neutral signals currently given by short-term moving averages show us that the global trend is losing momentum. The Central Indicators scanner does not detect any result on moving averages that would impact this trend.
The technical indicators are generally neutral. They do not provide relevant information on the direction of future price movements.
Central Indicators, the detector scanner for these technical indicators has recently detected several signals:
MACD crosses DOWN its Moving Average
Type : Bearish
Timeframe : Daily
Price is back under the pivot point
Type : Bearish
Timeframe : Daily
An analysis of the price chart with the Central Patterns scanner (detector of chart patterns and resistances and supports) shows a result that can have an impact on the price change:
Near support of channel
Type : Bullish
Timeframe : Daily
The Central Candlesticks scanner which studies Japanese candlesticks did not detect anything.
| S2 | S1 | Price | R1 | R2 | R3 | |
|---|---|---|---|---|---|---|
| ProTrendLines | 0.5605 | 0.5730 | 0.5746 | 0.5867 | 0.6035 | 0.6150 |
| Change (%) | -2.45% | -0.28% | - | +2.11% | +5.03% | +7.03% |
| Change | -0.0141 | -0.0016 | - | +0.0121 | +0.0289 | +0.0404 |
| Level | Major | Major | - | Major | Minor | Intermediate |
Pivot points can also be used to set your price objectives. Here is the price situation in relation to pivot points:
| Pivot points | S3 | S2 | S1 | PP | R1 | R2 | R3 |
|---|---|---|---|---|---|---|---|
| Standard | 0.5688 | 0.5708 | 0.5729 | 0.5749 | 0.5770 | 0.5790 | 0.5811 |
| Camarilla | 0.5739 | 0.5743 | 0.5746 | 0.5750 | 0.5754 | 0.5758 | 0.5761 |
| Woodie | 0.5689 | 0.5708 | 0.5730 | 0.5749 | 0.5771 | 0.5790 | 0.5812 |
| Fibonacci | 0.5708 | 0.5724 | 0.5733 | 0.5749 | 0.5765 | 0.5774 | 0.5790 |
| Pivot points | S3 | S2 | S1 | PP | R1 | R2 | R3 |
|---|---|---|---|---|---|---|---|
| Standard | 0.5553 | 0.5639 | 0.5689 | 0.5775 | 0.5825 | 0.5911 | 0.5961 |
| Camarilla | 0.5702 | 0.5714 | 0.5727 | 0.5739 | 0.5752 | 0.5764 | 0.5776 |
| Woodie | 0.5535 | 0.5630 | 0.5671 | 0.5766 | 0.5807 | 0.5902 | 0.5943 |
| Fibonacci | 0.5639 | 0.5691 | 0.5723 | 0.5775 | 0.5827 | 0.5859 | 0.5911 |
| Pivot points | S3 | S2 | S1 | PP | R1 | R2 | R3 |
|---|---|---|---|---|---|---|---|
| Standard | 0.5332 | 0.5472 | 0.5620 | 0.5760 | 0.5908 | 0.6048 | 0.6196 |
| Camarilla | 0.5688 | 0.5714 | 0.5741 | 0.5767 | 0.5793 | 0.5820 | 0.5846 |
| Woodie | 0.5335 | 0.5474 | 0.5623 | 0.5762 | 0.5911 | 0.6050 | 0.6199 |
| Fibonacci | 0.5472 | 0.5582 | 0.5650 | 0.5760 | 0.5870 | 0.5938 | 0.6048 |
Numerical data
The following are the details of the technical indicators and moving averages that were collected to generate this technical analysis:
| RSI (14): | 48.44 | |
| MACD (12,26,9): | 0.0003 | |
| Directional Movement: | -0.1946 | |
| AROON (14): | 50.0000 | |
| DEMA (21): | 0.5760 | |
| Parabolic SAR (0,02-0,02-0,2): | 0.5848 | |
| Elder Ray (13): | -0.0013 | |
| Super Trend (3,10): | 0.5697 | |
| Zig ZAG (10): | 0.5747 | |
| VORTEX (21): | 1.0605 | |
| Stochastique (14,3,5): | 49.93 | |
| TEMA (21): | 0.5766 | |
| Williams %R (14): | -49.78 | |
| Chande Momentum Oscillator (20): | 0.0028 | |
| Repulse (5,40,3): | -0.3048 | |
| ROCnROLL: | 2 | |
| TRIX (15,9): | 0.0064 | |
| Courbe Coppock: | 3.22 |
| MA7: | 0.5766 | |
| MA20: | 0.5736 | |
| MA50: | 0.5764 | |
| MA100: | 0.5777 | |
| MAexp7: | 0.5758 | |
| MAexp20: | 0.5757 | |
| MAexp50: | 0.5762 | |
| MAexp100: | 0.5808 | |
| Price / MA7: | -0.35% | |
| Price / MA20: | +0.17% | |
| Price / MA50: | -0.31% | |
| Price / MA100: | -0.54% | |
| Price / MAexp7: | -0.21% | |
| Price / MAexp20: | -0.19% | |
| Price / MAexp50: | -0.28% | |
| Price / MAexp100: | -1.07% |
News
Don't forget to follow the news on AUD/CHF. At the time of publication of this analysis, the latest news was as follows:
-
01/25/2017 - 04:30
 Forex Strategy Video: Why AUD/CHF May Have More Attractive Qualities than GBP/USD
-
09/28/2016 - 13:38
AUD/CHF Technical Levels
About author

Online


Add a comment
Comments
0 comments on the analysis AUD/CHF - Daily