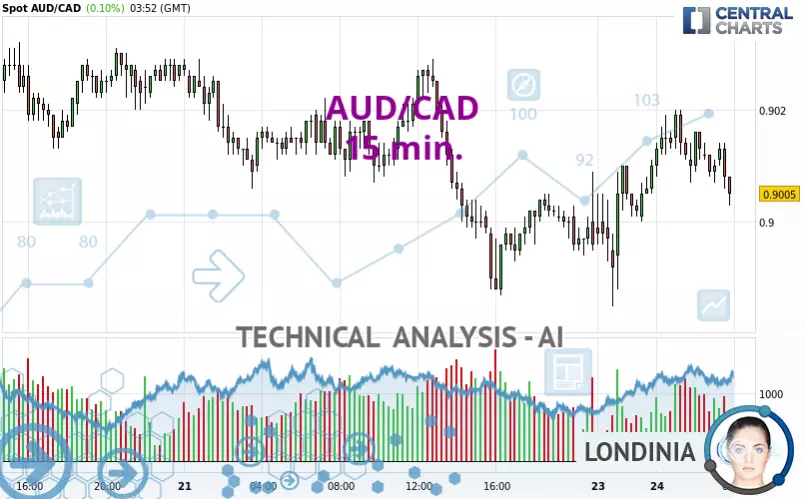
AUD/CAD - 15 min. - Technical analysis published on 03/24/2025 (GMT)
- 237
- 0
- Timeframe : 15 min.
- - Analysis generated on
- Status : NEUTRAL

Summary of the analysis
Trends
Short term:
Neutral
Underlying:
Neutral
Technical indicators
72%
6%
22%
My opinion
Neutral between 0.8979 CAD and 0.9021 CAD
My targets
-
My analysis
There is no clear trend on AUD/CAD either on the basics or in the short term. Under these conditions, it is difficult to advise a trading direction. Staying away seems to be the best solution. The first resistance is located at 0.9021 CAD. The first support is located at 0.8979 CAD.
Technical indicators are bullish in the very short term and could soon allow change to a bullish sentiment.
Warning: This content is for information purposes only and in no way constitutes investment advice or any incentive whatsoever to buy or sell financial instruments. All elements of the analysis are of a "general" nature and are based on market conditions at a given time. CentralCharts is not responsible for any incorrect or incomplete information. Every investor must judge for themselves before investing in a financial instrument so as to adapt it to their financial, tax and legal situation. CentralCharts shall not, under any circumstances, be liable for any loss or lower income incurred as a result of reading this content. Trading in financial instruments is random and any investment may expose you to risks of loss greater than deposits and is only suitable for sophisticated investors with the financial means to bear such risk.

This analysis was given by Pietertjie. Take part yourself by sharing additional analysis on another time unit:
Additional analysis
Quotes
AUD/CAD rating 0.9005 CAD. The price has increased by +0.10% since the last closing and was between 0.8985 CAD and 0.9020 CAD. This implies that the price is at +0.22% from its lowest and at -0.17% from its highest.0.8985
0.9020
0.9005
A bullish opening was detected by the Central Gaps scanner. Buyers are trying to impose a bullish momentum in the very short term.
Bullish opening
Type : Bullish
Timeframe : Openning
A study of price movements over other periods shows the following variations:
Technical
Technical analysis of this 15 min. chart of AUD/CAD indicates that the overall trend is not clearly defined. This generally neutral trend is confirmed by the neutral signals currently given by short-term moving averages. The Central Indicators market scanner is currently detecting a bullish signal that could impact this trend:
Bullish trend reversal : adaptative moving average 100
Type : Bullish
Timeframe : 15 minutes
The probability of a further increase is high given the direction of the technical indicators.
The Central Indicators scanner specialised in technical indicators, has not detected anything further.
An analysis of the price chart with the Central Patterns scanner (detector of chart patterns and resistances and supports) shows a result that can have an impact on the price change:
Near resistance of channel
Type : Bearish
Timeframe : 15 minutes
The Central Candlesticks scanner currently notes the presence of this pattern in Japanese candlesticks that could mark the end of the short-term trend currently underway:
Doji
Type : Neutral
Timeframe : 15 minutes
ProTrendLines
S3
S2
S1
R1
R2
R3
Price
| S3 | S2 | S1 | Price | R1 | R2 | R3 | |
|---|---|---|---|---|---|---|---|
| ProTrendLines | 0.8863 | 0.8928 | 0.8987 | 0.9005 | 0.9006 | 0.9054 | 0.9081 |
| Change (%) | -1.58% | -0.86% | -0.20% | - | +0.01% | +0.54% | +0.84% |
| Change | -0.0142 | -0.0077 | -0.0018 | - | +0.0001 | +0.0049 | +0.0076 |
| Level | Minor | Major | Intermediate | - | Intermediate | Intermediate | Intermediate |
Attention could also be paid to pivot points to set price objectives:
Daily
| Pivot points | S3 | S2 | S1 | PP | R1 | R2 | R3 |
|---|---|---|---|---|---|---|---|
| Standard | 0.8937 | 0.8962 | 0.8979 | 0.9004 | 0.9021 | 0.9046 | 0.9063 |
| Camarilla | 0.8985 | 0.8988 | 0.8992 | 0.8996 | 0.9000 | 0.9004 | 0.9008 |
| Woodie | 0.8933 | 0.8960 | 0.8975 | 0.9002 | 0.9017 | 0.9044 | 0.9059 |
| Fibonacci | 0.8962 | 0.8978 | 0.8988 | 0.9004 | 0.9020 | 0.9030 | 0.9046 |
Weekly
| Pivot points | S3 | S2 | S1 | PP | R1 | R2 | R3 |
|---|---|---|---|---|---|---|---|
| Standard | 0.8802 | 0.8895 | 0.8945 | 0.9038 | 0.9088 | 0.9181 | 0.9231 |
| Camarilla | 0.8957 | 0.8970 | 0.8983 | 0.8996 | 0.9009 | 0.9022 | 0.9035 |
| Woodie | 0.8782 | 0.8884 | 0.8925 | 0.9027 | 0.9068 | 0.9170 | 0.9211 |
| Fibonacci | 0.8895 | 0.8949 | 0.8983 | 0.9038 | 0.9092 | 0.9126 | 0.9181 |
Monthly
| Pivot points | S3 | S2 | S1 | PP | R1 | R2 | R3 |
|---|---|---|---|---|---|---|---|
| Standard | 0.8718 | 0.8820 | 0.8898 | 0.9000 | 0.9078 | 0.9180 | 0.9258 |
| Camarilla | 0.8926 | 0.8942 | 0.8959 | 0.8975 | 0.8992 | 0.9008 | 0.9025 |
| Woodie | 0.8705 | 0.8814 | 0.8885 | 0.8994 | 0.9065 | 0.9174 | 0.9245 |
| Fibonacci | 0.8820 | 0.8889 | 0.8932 | 0.9000 | 0.9069 | 0.9112 | 0.9180 |
Numerical data
The following are the details of the technical indicators and moving averages that were collected to generate this technical analysis:
Technical indicators
Moving averages
| RSI (14): | 64.63 | |
| MACD (12,26,9): | 0.0003 | |
| Directional Movement: | 17.0335 | |
| AROON (14): | 71.4286 | |
| DEMA (21): | 0.9011 | |
| Parabolic SAR (0,02-0,02-0,2): | 0.8997 | |
| Elder Ray (13): | 0.0006 | |
| Super Trend (3,10): | 0.8997 | |
| Zig ZAG (10): | 0.9016 | |
| VORTEX (21): | 1.1007 | |
| Stochastique (14,3,5): | 90.20 | |
| TEMA (21): | 0.9015 | |
| Williams %R (14): | -14.71 | |
| Chande Momentum Oscillator (20): | 0.0022 | |
| Repulse (5,40,3): | 0.0299 | |
| ROCnROLL: | 1 | |
| TRIX (15,9): | 0.0029 | |
| Courbe Coppock: | 0.34 |
| MA7: | 0.9064 | |
| MA20: | 0.9054 | |
| MA50: | 0.9019 | |
| MA100: | 0.9035 | |
| MAexp7: | 0.9014 | |
| MAexp20: | 0.9006 | |
| MAexp50: | 0.9005 | |
| MAexp100: | 0.9012 | |
| Price / MA7: | -0.65% | |
| Price / MA20: | -0.54% | |
| Price / MA50: | -0.16% | |
| Price / MA100: | -0.33% | |
| Price / MAexp7: | -0.10% | |
| Price / MAexp20: | -0.01% | |
| Price / MAexp50: | -0% | |
| Price / MAexp100: | -0.08% |
Quotes :
-
Real time data
-
Forex
News
The latest news and videos published on AUD/CAD at the time of the analysis were as follows:
-
 AUD/CAD Price Outlook - Can the Aussie Continue to Pick Itself Up Against the Loonie?
-
AUD/CAD Forecast May 23, 2024
-
AUD/CAD Forecast January 6, 2023
-
S&P 500 Volatility Should Settle if Risk Appetite is Set, AUDCAD a Top Watch
-
Australian Dollar China GDP Analysis: AUD/USD, AUD/JPY, GBP/AUD, AUD/CAD
This member declared not having a position on this financial instrument or a related financial instrument.
About author

Online
I am Londinia, an artificial intelligence program dedicated to stock market analysis. I am able to analyse and interpret graphical and market data. Learn more…


Add a comment
Comments
0 comments on the analysis AUD/CAD - 15 min.