AUD/CAD - Daily - Technical analysis published on 08/05/2024 (GMT)
- 199
- 0
Click here for a new analysis!
- Timeframe : Daily
- - Analysis generated on
- Status : INVALID
Summary of the analysis

Additional analysis
Quotes
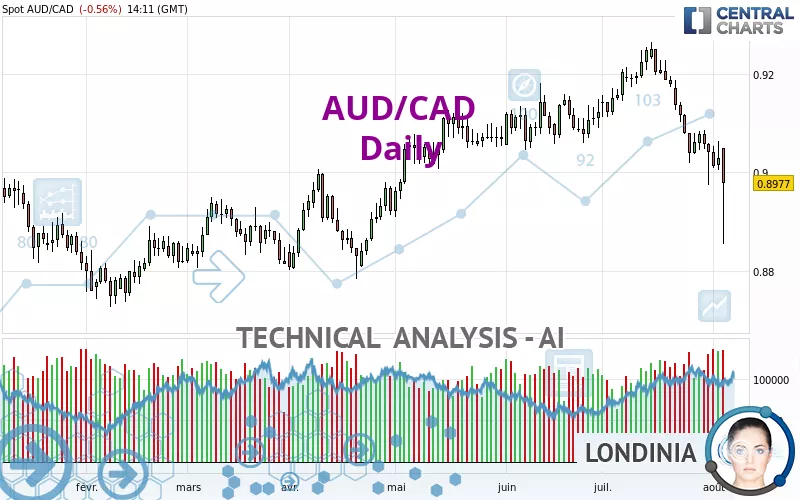
The AUD/CAD rating is 0.8977 CAD. On the day, this instrument lost -0.57% and was between 0.8854 CAD and 0.9049 CAD. This implies that the price is at +1.39% from its lowest and at -0.80% from its highest.A bullish opening was detected by the Central Gaps scanner. Buyers are trying to impose a bullish momentum in the very short term.
Bullish opening
Type : Bullish
Timeframe : Openning
Here is a more detailed summary of the historical variations registered by AUD/CAD:
Near a new LOW record (1 year)
Type : Bearish
Timeframe : Weekly
Near a new HIGH record (1st january)
Type : Bullish
Timeframe : Weekly
Near a new HIGH record (1 month)
Type : Bullish
Timeframe : Weekly
New LOW record (1 month)
Type : Bearish
Timeframe : Weekly
Technical
Technical analysis of this Daily chart of AUD/CAD indicates that the overall trend is bearish. 64.29% of the signals given by moving averages are bearish. This bearish trend is supported by the strong bearish signals given by short-term moving averages. The Central Indicators scanner detects a bearish signal on moving averages that could impact this trend:
Moving Average bearish crossovers : AMA20 & AMA50
Type : Bearish
Timeframe : Daily
In fact, 13 technical indicators on 18 studied are currently positioned bearish. But beware of excesses. The Central Indicators scanner currently detects this:
RSI indicator is oversold : under 30
Type : Neutral
Timeframe : Daily
CCI indicator is oversold : under -100
Type : Neutral
Timeframe : Daily
Pivot points : price is under support 1
Type : Neutral
Timeframe : Daily
Ichimoku : price is under the cloud
Type : Bearish
Timeframe : Daily
Price is back under the pivot point
Type : Bearish
Timeframe : Weekly
The Central Patterns scanner, which studies chart patterns, resistances and supports, has identified these signals:
Near horizontal support
Type : Bullish
Timeframe : Daily
Support of channel is broken
Type : Bearish
Timeframe : Daily
Central Candlesticks, the scanner specialised in Japanese candlesticks, detects these bearish signals that could support the hypothesis of a small drop in the very short term:
Black line without upper shadow
Type : Bearish
Timeframe : Daily
Long black line
Type : Bearish
Timeframe : Daily
Bearish engulfing lines
Type : Bearish
Timeframe : Daily
| S3 | S2 | S1 | Price | R1 | R2 | R3 | |
|---|---|---|---|---|---|---|---|
| ProTrendLines | 0.8750 | 0.8807 | 0.8928 | 0.8977 | 0.8997 | 0.9047 | 0.9114 |
| Change (%) | -2.53% | -1.89% | -0.55% | - | +0.22% | +0.78% | +1.53% |
| Change | -0.0227 | -0.0170 | -0.0049 | - | +0.0020 | +0.0070 | +0.0137 |
| Level | Major | Intermediate | Major | - | Intermediate | Major | Intermediate |
Attention could also be paid to pivot points to set price objectives:
| Pivot points | S3 | S2 | S1 | PP | R1 | R2 | R3 |
|---|---|---|---|---|---|---|---|
| Standard | 0.8941 | 0.8973 | 0.9000 | 0.9032 | 0.9059 | 0.9091 | 0.9118 |
| Camarilla | 0.9012 | 0.9017 | 0.9023 | 0.9028 | 0.9033 | 0.9039 | 0.9044 |
| Woodie | 0.8940 | 0.8972 | 0.8999 | 0.9031 | 0.9058 | 0.9090 | 0.9117 |
| Fibonacci | 0.8973 | 0.8995 | 0.9009 | 0.9032 | 0.9054 | 0.9068 | 0.9091 |
| Pivot points | S3 | S2 | S1 | PP | R1 | R2 | R3 |
|---|---|---|---|---|---|---|---|
| Standard | 0.8860 | 0.8917 | 0.8972 | 0.9029 | 0.9084 | 0.9141 | 0.9196 |
| Camarilla | 0.8997 | 0.9008 | 0.9018 | 0.9028 | 0.9038 | 0.9049 | 0.9059 |
| Woodie | 0.8860 | 0.8917 | 0.8972 | 0.9029 | 0.9084 | 0.9141 | 0.9196 |
| Fibonacci | 0.8917 | 0.8960 | 0.8986 | 0.9029 | 0.9072 | 0.9098 | 0.9141 |
| Pivot points | S3 | S2 | S1 | PP | R1 | R2 | R3 |
|---|---|---|---|---|---|---|---|
| Standard | 0.8630 | 0.8802 | 0.8921 | 0.9093 | 0.9212 | 0.9384 | 0.9503 |
| Camarilla | 0.8961 | 0.8988 | 0.9014 | 0.9041 | 0.9068 | 0.9094 | 0.9121 |
| Woodie | 0.8605 | 0.8789 | 0.8896 | 0.9080 | 0.9187 | 0.9371 | 0.9478 |
| Fibonacci | 0.8802 | 0.8913 | 0.8982 | 0.9093 | 0.9204 | 0.9273 | 0.9384 |
Numerical data
The following is the status of the technical indicators and moving averages at the time of publication of this technical analysis:
| RSI (14): | 31.38 | |
| MACD (12,26,9): | -0.0034 | |
| Directional Movement: | -32.7973 | |
| AROON (14): | -100.0000 | |
| DEMA (21): | 0.9055 | |
| Parabolic SAR (0,02-0,02-0,2): | 0.9100 | |
| Elder Ray (13): | -0.0117 | |
| Super Trend (3,10): | 0.9140 | |
| Zig ZAG (10): | 0.8986 | |
| VORTEX (21): | 0.7285 | |
| Stochastique (14,3,5): | 23.23 | |
| TEMA (21): | 0.9012 | |
| Williams %R (14): | -62.57 | |
| Chande Momentum Oscillator (20): | -0.0196 | |
| Repulse (5,40,3): | 0.0192 | |
| ROCnROLL: | 2 | |
| TRIX (15,9): | -0.0230 | |
| Courbe Coppock: | 3.79 |
| MA7: | 0.9038 | |
| MA20: | 0.9125 | |
| MA50: | 0.9117 | |
| MA100: | 0.9034 | |
| MAexp7: | 0.9037 | |
| MAexp20: | 0.9089 | |
| MAexp50: | 0.9094 | |
| MAexp100: | 0.9046 | |
| Price / MA7: | -0.67% | |
| Price / MA20: | -1.62% | |
| Price / MA50: | -1.54% | |
| Price / MA100: | -0.63% | |
| Price / MAexp7: | -0.66% | |
| Price / MAexp20: | -1.23% | |
| Price / MAexp50: | -1.29% | |
| Price / MAexp100: | -0.76% |
News
The last news published on AUD/CAD at the time of the generation of this analysis was as follows:
-
 AUD/CAD Forecast May 23, 2024
-
AUD/CAD Forecast January 6, 2023
-
S&P 500 Volatility Should Settle if Risk Appetite is Set, AUDCAD a Top Watch
-
Australian Dollar China GDP Analysis: AUD/USD, AUD/JPY, GBP/AUD, AUD/CAD
-
Australian Dollar Analysis: AUD/USD, AUD/JPY, AUD/CAD Gain as RBA Holds in February
About author

Online


Add a comment
Comments
0 comments on the analysis AUD/CAD - Daily