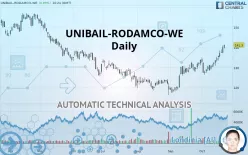
UNIBAIL-RODAMCO-WE - Daily - Technical analysis published on 10/22/2019 (GMT)
- 334
- 0
- Who voted?
Click here for a new analysis!
- Timeframe : Daily
- - Analysis generated on
- Status : TARGET REACHED

Summary of the analysis

Additional analysis
Quotes
UNIBAIL-RODAMCO-WE rating 141.30 EUR. The price has increased by +0.89% since the last closing and was between 139.35 EUR and 141.35 EUR. This implies that the price is at +1.40% from its lowest and at -0.04% from its highest.A bearish opening was detected by the Central Gaps scanner. Sellers are trying to impose a bearish trend in the very short term.
Bearish opening
Type : Bearish
Timeframe : Openning
A study of price movements over other periods shows the following variations:
Technical
Technical analysis of this Daily chart of UNIBAIL-RODAMCO-WE indicates that the overall trend is strongly bullish. The signals given by the moving averages are 92.86% bullish. This strong bullish trend is confirmed by the strong signals currently being given by short-term moving averages. The Central Indicators market scanner is currently detecting a bullish signal that could impact this trend:
Moving Average bullish crossovers : AMA50 & AMA100
Type : Bullish
Timeframe : Daily
In fact, 17 technical indicators on 18 studied are currently positioned bullish. Caution: the Central Indicators scanner currently detects an excess:
RSI indicator is overbought : over 70
Type : Neutral
Timeframe : Daily
CCI indicator is overbought : over 100
Type : Neutral
Timeframe : Daily
Williams %R indicator is overbought : over -20
Type : Neutral
Timeframe : Daily
Pivot points : price is over resistance 1
Type : Neutral
Timeframe : Weekly
Price is back over the pivot point
Type : Bullish
Timeframe : Daily
Central Patterns, the market scanner focusing on chart patterns, resistances and supports found these results:
Horizontal resistance is broken
Type : Bullish
Timeframe : Daily
Resistance of channel is broken
Type : Bullish
Timeframe : Daily
The Central Candlesticks scanner, specialised in Japanese candlesticks, did not identify any signals.
| S3 | S2 | S1 | Price | R1 | R2 | R3 | |
|---|---|---|---|---|---|---|---|
| ProTrendLines | 127.45 | 132.56 | 138.30 | 141.30 | 141.92 | 145.86 | 153.00 |
| Change (%) | -9.80% | -6.19% | -2.12% | - | +0.44% | +3.23% | +8.28% |
| Change | -13.85 | -8.74 | -3.00 | - | +0.62 | +4.56 | +11.70 |
| Level | Major | Major | Intermediate | - | Intermediate | Minor | Minor |
To determine price objectives, it is also possible to use the pivot points. Here is the price position in relation to pivot points:
| Pivot points | S3 | S2 | S1 | PP | R1 | R2 | R3 |
|---|---|---|---|---|---|---|---|
| Standard | 133.78 | 135.42 | 137.73 | 139.37 | 141.68 | 143.32 | 145.63 |
| Camarilla | 138.96 | 139.33 | 139.69 | 140.05 | 140.41 | 140.77 | 141.14 |
| Woodie | 134.13 | 135.59 | 138.08 | 139.54 | 142.03 | 143.49 | 145.98 |
| Fibonacci | 135.42 | 136.93 | 137.86 | 139.37 | 140.88 | 141.81 | 143.32 |
| Pivot points | S3 | S2 | S1 | PP | R1 | R2 | R3 |
|---|---|---|---|---|---|---|---|
| Standard | 124.62 | 127.78 | 132.72 | 135.88 | 140.82 | 143.98 | 148.92 |
| Camarilla | 135.42 | 136.17 | 136.91 | 137.65 | 138.39 | 139.14 | 139.88 |
| Woodie | 125.50 | 128.23 | 133.60 | 136.33 | 141.70 | 144.43 | 149.80 |
| Fibonacci | 127.78 | 130.88 | 132.79 | 135.88 | 138.98 | 140.89 | 143.98 |
| Pivot points | S3 | S2 | S1 | PP | R1 | R2 | R3 |
|---|---|---|---|---|---|---|---|
| Standard | 106.23 | 111.82 | 122.78 | 128.37 | 139.33 | 144.92 | 155.88 |
| Camarilla | 129.20 | 130.72 | 132.23 | 133.75 | 135.27 | 136.78 | 138.30 |
| Woodie | 108.93 | 113.16 | 125.48 | 129.71 | 142.03 | 146.26 | 158.58 |
| Fibonacci | 111.82 | 118.14 | 122.05 | 128.37 | 134.69 | 138.60 | 144.92 |
Numerical data
The following is the status of technical indicators and moving averages registered at the time this technical analysis was created:
| RSI (14): | 72.62 | |
| MACD (12,26,9): | 3.1200 | |
| Directional Movement: | 24.34 | |
| AROON (14): | 92.86 | |
| DEMA (21): | 137.38 | |
| Parabolic SAR (0,02-0,02-0,2): | 130.79 | |
| Elder Ray (13): | 5.06 | |
| Super Trend (3,10): | 132.32 | |
| Zig ZAG (10): | 141.15 | |
| VORTEX (21): | 1.1800 | |
| Stochastique (14,3,5): | 93.70 | |
| TEMA (21): | 138.98 | |
| Williams %R (14): | -1.34 | |
| Chande Momentum Oscillator (20): | 12.20 | |
| Repulse (5,40,3): | 3.8700 | |
| ROCnROLL: | 1 | |
| TRIX (15,9): | 0.2600 | |
| Courbe Coppock: | 10.27 |
| MA7: | 137.15 | |
| MA20: | 132.87 | |
| MA50: | 127.48 | |
| MA100: | 127.39 | |
| MAexp7: | 137.48 | |
| MAexp20: | 133.58 | |
| MAexp50: | 130.07 | |
| MAexp100: | 129.82 | |
| Price / MA7: | +3.03% | |
| Price / MA20: | +6.34% | |
| Price / MA50: | +10.84% | |
| Price / MA100: | +10.92% | |
| Price / MAexp7: | +2.78% | |
| Price / MAexp20: | +5.78% | |
| Price / MAexp50: | +8.63% | |
| Price / MAexp100: | +8.84% |
News
The last news published on UNIBAIL-RODAMCO-WE at the time of the generation of this analysis was as follows:
- Unibail-Rodamco-Westfield announces the placement of a USD750 Mn bond offering
- UNIBAIL-RODAMCO-WESTFIELD SE : Information on total number of voting rights and shares - August 31, 2019
- UNIBAIL-RODAMCO-WESTFIELD: Information on total number of voting rights and shares of Unibail-Rodamco-Westfield SE
- UNIBAIL-RODAMCO-WESTFIELD, THE PREMIER GLOBAL DEVELOPER AND OPERATOR OF FLAGSHIP DESTINATIONS, REPORTS SOLID RESULTS FOR H1-2019
- Unibail-Rodamco-Westfield (“URW”) announces the successful refinancing of Westfield Stratford City
About author

Online


Add a comment
Comments
0 comments on the analysis UNIBAIL-RODAMCO-WE - Daily