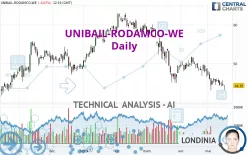
UNIBAIL-RODAMCO-WE - Daily - Technical analysis published on 05/17/2023 (GMT)
- 228
- 0
Click here for a new analysis!
- Timeframe : Daily
- - Analysis generated on
- Status : LEVEL MAINTAINED

Summary of the analysis

Additional analysis
Quotes
UNIBAIL-RODAMCO-WE rating 44.39 EUR. The price registered a decrease of -0.07% on the session and was traded between 43.22 EUR and 44.40 EUR over the period. The price is currently at +2.71% from its lowest and -0.02% from its highest.A bearish gap was detected at the opening by the Central Gaps scanner. There are a lot of sellers and they have the upper hand in the very short term.
Opening Gap DOWN
Type : Bearish
Timeframe : Openning
So that you have an overall view of the price change, here is a table showing the variations over several periods:
Near a new LOW record (1st january)
Type : Bearish
Timeframe : Weekly
Near a new LOW record (1 month)
Type : Bearish
Timeframe : Weekly
Technical
Technical analysis of this Daily chart of UNIBAIL-RODAMCO-WE indicates that the overall trend is strongly bearish. The signals given by moving averages are 92.86% bearish. This strong bearish trend is confirmed by the strong signals currently being given by short-term moving averages. The Central Indicators market scanner currently does not detect any result that concerns moving averages.
In fact, 11 technical indicators on 18 studied are currently bearish. Caution: the Central Indicators scanner currently detects an excess:
CCI indicator is oversold : under -100
Type : Neutral
Timeframe : Daily
MACD indicator: bullish divergence
Type : Bullish
Timeframe : Daily
Williams %R indicator is oversold : under -80
Type : Neutral
Timeframe : Daily
Central Patterns, the market scanner focusing on chart patterns, resistances and supports found this result:
Near support of channel
Type : Bullish
Timeframe : Daily
Central Candlesticks, the scanner specialised in Japanese candlesticks, detects this inversion signal that could impact the current short-term trend:
White hanging man / hammer
Type : Neutral
Timeframe : Daily
| S3 | S2 | S1 | Price | R1 | R2 | R3 | |
|---|---|---|---|---|---|---|---|
| ProTrendLines | 29.87 | 40.97 | 43.80 | 44.39 | 47.70 | 51.60 | 55.45 |
| Change (%) | -32.71% | -7.70% | -1.33% | - | +7.46% | +16.24% | +24.92% |
| Change | -14.52 | -3.42 | -0.59 | - | +3.31 | +7.21 | +11.06 |
| Level | Minor | Major | Intermediate | - | Minor | Major | Minor |
Attention could also be paid to pivot points to set price objectives:
| Pivot points | S3 | S2 | S1 | PP | R1 | R2 | R3 |
|---|---|---|---|---|---|---|---|
| Standard | 42.42 | 43.34 | 43.88 | 44.80 | 45.34 | 46.26 | 46.80 |
| Camarilla | 44.02 | 44.15 | 44.29 | 44.42 | 44.55 | 44.69 | 44.82 |
| Woodie | 42.23 | 43.25 | 43.69 | 44.71 | 45.15 | 46.17 | 46.61 |
| Fibonacci | 43.34 | 43.90 | 44.24 | 44.80 | 45.36 | 45.70 | 46.26 |
| Pivot points | S3 | S2 | S1 | PP | R1 | R2 | R3 |
|---|---|---|---|---|---|---|---|
| Standard | 41.75 | 43.00 | 43.77 | 45.02 | 45.79 | 47.04 | 47.81 |
| Camarilla | 43.99 | 44.17 | 44.36 | 44.54 | 44.73 | 44.91 | 45.10 |
| Woodie | 41.51 | 42.88 | 43.53 | 44.90 | 45.55 | 46.92 | 47.57 |
| Fibonacci | 43.00 | 43.77 | 44.25 | 45.02 | 45.79 | 46.27 | 47.04 |
| Pivot points | S3 | S2 | S1 | PP | R1 | R2 | R3 |
|---|---|---|---|---|---|---|---|
| Standard | 40.83 | 43.71 | 46.13 | 49.01 | 51.43 | 54.31 | 56.73 |
| Camarilla | 47.08 | 47.57 | 48.05 | 48.54 | 49.03 | 49.51 | 50.00 |
| Woodie | 40.59 | 43.60 | 45.89 | 48.90 | 51.19 | 54.20 | 56.49 |
| Fibonacci | 43.71 | 45.74 | 46.99 | 49.01 | 51.04 | 52.29 | 54.31 |
Numerical data
The following is the status of the technical indicators and moving averages at the time of publication of this technical analysis:
| RSI (14): | 35.28 | |
| MACD (12,26,9): | -1.5400 | |
| Directional Movement: | -20.64 | |
| AROON (14): | -35.71 | |
| DEMA (21): | 44.40 | |
| Parabolic SAR (0,02-0,02-0,2): | 45.92 | |
| Elder Ray (13): | -1.87 | |
| Super Trend (3,10): | 48.29 | |
| Zig ZAG (10): | 44.38 | |
| VORTEX (21): | 0.7700 | |
| Stochastique (14,3,5): | 21.41 | |
| TEMA (21): | 44.26 | |
| Williams %R (14): | -81.72 | |
| Chande Momentum Oscillator (20): | -4.18 | |
| Repulse (5,40,3): | -0.4800 | |
| ROCnROLL: | 2 | |
| TRIX (15,9): | -0.4200 | |
| Courbe Coppock: | 16.08 |
| MA7: | 44.94 | |
| MA20: | 46.73 | |
| MA50: | 49.58 | |
| MA100: | 53.32 | |
| MAexp7: | 44.95 | |
| MAexp20: | 46.45 | |
| MAexp50: | 49.19 | |
| MAexp100: | 51.13 | |
| Price / MA7: | -1.22% | |
| Price / MA20: | -5.01% | |
| Price / MA50: | -10.47% | |
| Price / MA100: | -16.75% | |
| Price / MAexp7: | -1.25% | |
| Price / MAexp20: | -4.43% | |
| Price / MAexp50: | -9.76% | |
| Price / MAexp100: | -13.18% |
News
The latest news and videos published on UNIBAIL-RODAMCO-WE at the time of the analysis were as follows:
- URW SE - Information on total number of voting rights and shares in the share capital as at April 30, 2023
- Unibail-Rodamco-Westfield Q1-2023 Trading Update
- Unibail-Rodamco-Westfield acquires outstanding share of Croydon Partnership from Hammerson
- Unibail-Rodamco-Westfield SE announces changes to Management Board
- Unibail-Rodamco-Westfield: Deferral of conversions between CDIs and stapled shares in respect of 2023 Unibail-Rodamco-Westfield SE Annual General Meeting
About author
Online


Add a comment
Comments
0 comments on the analysis UNIBAIL-RODAMCO-WE - Daily