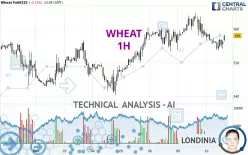
WHEAT - 1H - Technical analysis published on 12/10/2024 (GMT)
- 113
- 0
- Timeframe : 1H
- - Analysis generated on
- Status : NEUTRAL

Summary of the analysis

Additional analysis
Quotes
WHEAT rating 558.00 USD. The price is lower by -0.13% since the last closing and was traded between 553.75 USD and 559.00 USD over the period. The price is currently at +0.77% from its lowest and -0.18% from its highest.A bearish opening was detected by the Central Gaps scanner. Sellers are trying to impose a bearish trend in the very short term.
Bearish opening
Type : Bearish
Timeframe : Openning
A study of price movements over other periods shows the following variations:
Near a new LOW record (5 years)
Type : Bearish
Timeframe : Weekly
Near a new LOW record (1 year)
Type : Bearish
Timeframe : Weekly
Near a new LOW record (1st january)
Type : Bearish
Timeframe : Weekly
Near a new LOW record (1 month)
Type : Bearish
Timeframe : Weekly
Technical
A technical analysis in 1H of this WHEAT chart shows a slightly bullish trend. 60.71% of the signals given by moving averages are bullish. As the signals currently given by short-term moving averages are rather neutral, the overall trend could quickly return to neutral as well. There is no crossing of moving average by the price or crossing of moving averages between themselves.
An assessment of technical indicators does not currently provide any relevant information to suggest whether the signal given by the technical indicators is more bullish or bearish.
Other results related to technical indicators were also found by the Central Indicators scanner:
Ichimoku : price is over the cloud
Type : Bullish
Timeframe : 1 hour
Williams %R indicator is back over -50
Type : Bullish
Timeframe : 1 hour
No signals are given by Central Patterns, a market scanner specialised in chart patterns, resistances and supports.
The Central Candlesticks scanner, specialised in Japanese candlesticks, did not identify any signals.
| S3 | S2 | S1 | Price | R1 | R2 | R3 | |
|---|---|---|---|---|---|---|---|
| ProTrendLines | 545.70 | 553.25 | 556.45 | 558.00 | 560.50 | 564.50 | 568.50 |
| Change (%) | -2.20% | -0.85% | -0.28% | - | +0.45% | +1.16% | +1.88% |
| Change | -12.30 | -4.75 | -1.55 | - | +2.50 | +6.50 | +10.50 |
| Level | Minor | Intermediate | Intermediate | - | Intermediate | Major | Minor |
To determine price objectives, it is also possible to use the pivot points. Here is the price position in relation to pivot points:
| Pivot points | S3 | S2 | S1 | PP | R1 | R2 | R3 |
|---|---|---|---|---|---|---|---|
| Standard | 542.42 | 548.08 | 553.42 | 559.08 | 564.42 | 570.08 | 575.42 |
| Camarilla | 555.73 | 556.73 | 557.74 | 558.75 | 559.76 | 560.77 | 561.78 |
| Woodie | 542.25 | 548.00 | 553.25 | 559.00 | 564.25 | 570.00 | 575.25 |
| Fibonacci | 548.08 | 552.29 | 554.88 | 559.08 | 563.29 | 565.88 | 570.08 |
| Pivot points | S3 | S2 | S1 | PP | R1 | R2 | R3 |
|---|---|---|---|---|---|---|---|
| Standard | 524.58 | 532.42 | 544.83 | 552.67 | 565.08 | 572.92 | 585.33 |
| Camarilla | 551.68 | 553.54 | 555.39 | 557.25 | 559.11 | 560.96 | 562.82 |
| Woodie | 526.88 | 533.56 | 547.13 | 553.81 | 567.38 | 574.06 | 587.63 |
| Fibonacci | 532.42 | 540.15 | 544.93 | 552.67 | 560.40 | 565.18 | 572.92 |
| Pivot points | S3 | S2 | S1 | PP | R1 | R2 | R3 |
|---|---|---|---|---|---|---|---|
| Standard | 473.40 | 508.20 | 528.10 | 562.90 | 582.80 | 617.60 | 637.50 |
| Camarilla | 532.96 | 537.97 | 542.99 | 548.00 | 553.01 | 558.03 | 563.04 |
| Woodie | 465.95 | 504.48 | 520.65 | 559.18 | 575.35 | 613.88 | 630.05 |
| Fibonacci | 508.20 | 529.10 | 542.01 | 562.90 | 583.80 | 596.71 | 617.60 |
Numerical data
The following are the details of the technical indicators and moving averages that were collected to generate this technical analysis:
| RSI (14): | 47.52 | |
| MACD (12,26,9): | -0.8800 | |
| Directional Movement: | -11.70 | |
| AROON (14): | -57.15 | |
| DEMA (21): | 556.26 | |
| Parabolic SAR (0,02-0,02-0,2): | 557.81 | |
| Elder Ray (13): | -0.07 | |
| Super Trend (3,10): | 560.96 | |
| Zig ZAG (10): | 557.25 | |
| VORTEX (21): | 0.9000 | |
| Stochastique (14,3,5): | 41.17 | |
| TEMA (21): | 555.20 | |
| Williams %R (14): | -37.50 | |
| Chande Momentum Oscillator (20): | 0.00 | |
| Repulse (5,40,3): | 0.3500 | |
| ROCnROLL: | 1 | |
| TRIX (15,9): | -0.0200 | |
| Courbe Coppock: | 1.44 |
| MA7: | 553.54 | |
| MA20: | 556.74 | |
| MA50: | 581.72 | |
| MA100: | 581.45 | |
| MAexp7: | 556.36 | |
| MAexp20: | 557.20 | |
| MAexp50: | 557.13 | |
| MAexp100: | 555.98 | |
| Price / MA7: | +0.81% | |
| Price / MA20: | +0.23% | |
| Price / MA50: | -4.08% | |
| Price / MA100: | -4.03% | |
| Price / MAexp7: | +0.29% | |
| Price / MAexp20: | +0.14% | |
| Price / MAexp50: | +0.16% | |
| Price / MAexp100: | +0.36% |
News
Don't forget to follow the news on WHEAT. At the time of publication of this analysis, the latest news was as follows:
-
 Trading the trend: short Chicago wheat
-
Trading into 2024: Chicago Wheat and an early possibly entry into Elliot Wave
-
Watch wheat, corn, soy price volatility, rising Black Sea tensions
-
AI – How to sort the ‘wheat from the chaff’
-
Wheat prices soar as Russia bombs Ukraine's grain stores - BBC News
About author

Online


Add a comment
Comments
0 comments on the analysis WHEAT - 1H