| Open: | 7,949.23 |
| Change: | -74.03 |
| Volume: | 4,391,835 |
| Low: | 7,894.62 |
| High: | 7,975.55 |
| High / Low range: | 80.93 |
| Type: | Commodities |
| Ticker: | WWY |
| ISIN: |
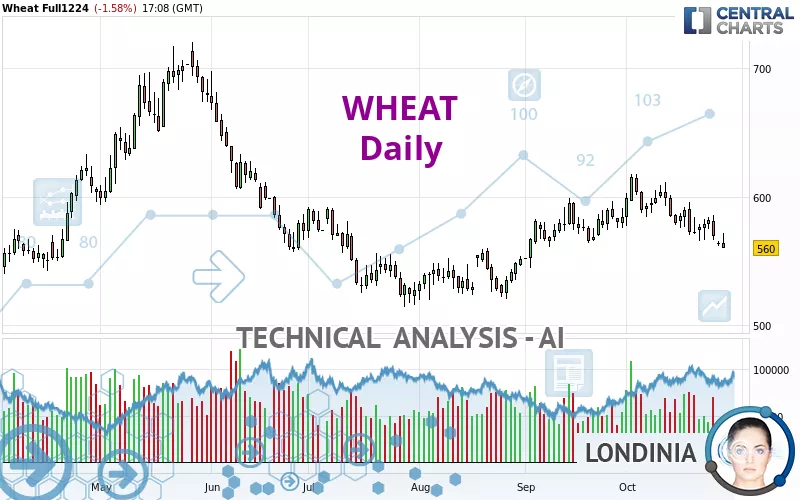
WHEAT - Daily - Technical analysis published on 10/28/2024 (GMT)
- 104
- 0
- 10/28/2024 - 17:19
Click here for a new analysis!
- Timeframe : Daily
- - Analysis generated on 10/28/2024 - 17:19
- Status : INVALID

Summary of the analysis

Additional analysis
Quotes
The WHEAT price is 560.00 USD. The price registered a decrease of -1.58% on the session and was between 559.75 USD and 571.50 USD. This implies that the price is at +0.04% from its lowest and at -2.01% from its highest.The Central Gaps scanner detects the formation of a bearish gap marking the strong presence of sellers ahead of buyers at the opening. This formed a quotation gap.
Opening Gap DOWN
Type : Bearish
Timeframe : Openning
Here is a more detailed summary of the historical variations registered by WHEAT:
New LOW record (1 month)
Type : Bearish
Timeframe : Weekly
Technical
A technical analysis in Daily of this WHEAT chart shows a bearish trend. 75.00% of the signals given by moving averages are bearish. This bearish trend is supported by the strong bearish signals given by short-term moving averages. There is no crossing of moving average by the price or crossing of moving averages between themselves.
In fact, of the 18 technical indicators analysed by Central Analyzer, 4 are bullish, 2 are neutral and 12 are bearish. Caution: the Central Indicators scanner currently detects an excess:
CCI indicator is oversold : under -100
Type : Neutral
Timeframe : Daily
Williams %R indicator is oversold : under -80
Type : Neutral
Timeframe : Daily
Ichimoku : price is under the cloud
Type : Bearish
Timeframe : Daily
No signals are given by Central Patterns, a market scanner specialised in chart patterns, resistances and supports.
The Central Candlesticks scanner currently notes the presence of this pattern in Japanese candlesticks that could mark the end of the short-term trend currently underway:
Black hanging man / hammer
Type : Neutral
Timeframe : Daily
| S2 | S1 | Price | R1 | R2 | R3 | |
|---|---|---|---|---|---|---|
| ProTrendLines | 525.00 | 546.25 | 560.00 | 565.60 | 582.50 | 614.17 |
| Change (%) | -6.25% | -2.46% | - | +1.00% | +4.02% | +9.67% |
| Change | -35.00 | -13.75 | - | +5.60 | +22.50 | +54.17 |
| Level | Intermediate | Minor | - | Major | Major | Major |
Attention could also be paid to pivot points to set price objectives:
| Pivot points | S3 | S2 | S1 | PP | R1 | R2 | R3 |
|---|---|---|---|---|---|---|---|
| Standard | 542.00 | 554.00 | 561.50 | 573.50 | 581.00 | 593.00 | 600.50 |
| Camarilla | 563.64 | 565.43 | 567.21 | 569.00 | 570.79 | 572.58 | 574.36 |
| Woodie | 539.75 | 552.88 | 559.25 | 572.38 | 578.75 | 591.88 | 598.25 |
| Fibonacci | 554.00 | 561.45 | 566.05 | 573.50 | 580.95 | 585.55 | 593.00 |
| Pivot points | S3 | S2 | S1 | PP | R1 | R2 | R3 |
|---|---|---|---|---|---|---|---|
| Standard | 541.58 | 553.67 | 561.33 | 573.42 | 581.08 | 593.17 | 600.83 |
| Camarilla | 563.57 | 565.38 | 567.19 | 569.00 | 570.81 | 572.62 | 574.43 |
| Woodie | 539.38 | 552.56 | 559.13 | 572.31 | 578.88 | 592.06 | 598.63 |
| Fibonacci | 553.67 | 561.21 | 565.87 | 573.42 | 580.96 | 585.62 | 593.17 |
| Pivot points | S3 | S2 | S1 | PP | R1 | R2 | R3 |
|---|---|---|---|---|---|---|---|
| Standard | 503.08 | 523.67 | 561.33 | 581.92 | 619.58 | 640.17 | 677.83 |
| Camarilla | 582.98 | 588.32 | 593.66 | 599.00 | 604.34 | 609.68 | 615.02 |
| Woodie | 511.63 | 527.94 | 569.88 | 586.19 | 628.13 | 644.44 | 686.38 |
| Fibonacci | 523.67 | 545.92 | 559.67 | 581.92 | 604.17 | 617.92 | 640.17 |
Numerical data
The following are the details of the technical indicators and moving averages that were collected to generate this technical analysis:
| RSI (14): | 39.72 | |
| MACD (12,26,9): | -2.7200 | |
| Directional Movement: | -6.17 | |
| AROON (14): | -78.57 | |
| DEMA (21): | 578.72 | |
| Parabolic SAR (0,02-0,02-0,2): | 591.01 | |
| Elder Ray (13): | -11.88 | |
| Super Trend (3,10): | 561.83 | |
| Zig ZAG (10): | 562.00 | |
| VORTEX (21): | 0.9600 | |
| Stochastique (14,3,5): | 14.42 | |
| TEMA (21): | 572.58 | |
| Williams %R (14): | -98.50 | |
| Chande Momentum Oscillator (20): | -41.75 | |
| Repulse (5,40,3): | -2.9100 | |
| ROCnROLL: | 2 | |
| TRIX (15,9): | 0.0300 | |
| Courbe Coppock: | 7.67 |
| MA7: | 573.14 | |
| MA20: | 587.44 | |
| MA50: | 574.26 | |
| MA100: | 578.63 | |
| MAexp7: | 573.65 | |
| MAexp20: | 580.28 | |
| MAexp50: | 580.19 | |
| MAexp100: | 588.63 | |
| Price / MA7: | -2.29% | |
| Price / MA20: | -4.67% | |
| Price / MA50: | -2.48% | |
| Price / MA100: | -3.22% | |
| Price / MAexp7: | -2.38% | |
| Price / MAexp20: | -3.49% | |
| Price / MAexp50: | -3.48% | |
| Price / MAexp100: | -4.86% |
News
Don't forget to follow the news on WHEAT. At the time of publication of this analysis, the latest news was as follows:
-
03/06/2024 - 10:39
 Trading the trend: short Chicago wheat
-
01/05/2024 - 08:00
Trading into 2024: Chicago Wheat and an early possibly entry into Elliot Wave
-
08/14/2023 - 13:00
Watch wheat, corn, soy price volatility, rising Black Sea tensions
-
07/28/2023 - 11:57
AI – How to sort the ‘wheat from the chaff’
-
07/20/2023 - 22:10
Wheat prices soar as Russia bombs Ukraine's grain stores - BBC News
About author

Online


Add a comment
Comments
0 comments on the analysis WHEAT - Daily