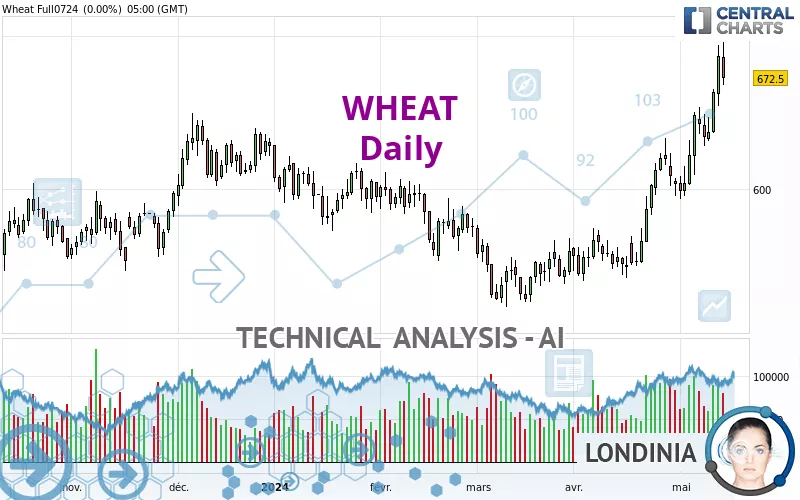
WHEAT - Daily - Technical analysis published on 05/15/2024 (GMT)
- 113
- 0
Click here for a new analysis!
- Timeframe : Daily
- - Analysis generated on
- Status : INVALID

Summary of the analysis

Additional analysis
Quotes
WHEAT rating 675.50 USD. The price has increased by +0.45% since the last closing with the lowest point at 670.50 USD and the highest point at 682.50 USD. The deviation from the price is +0.75% for the low point and -1.03% for the high point.A bullish opening was detected by the Central Gaps scanner. Buyers are trying to impose a bullish momentum in the very short term.
Bullish opening
Type : Bullish
Timeframe : Openning
So that you have an overall view of the price change, here is a table showing the variations over several periods:
Near a new HIGH record (1st january)
Type : Bullish
Timeframe : Weekly
Near a new HIGH record (1 month)
Type : Bullish
Timeframe : Weekly
Technical
Technical analysis of WHEAT in Daily shows a strongly overall bullish trend. 89.29% of the signals given by moving averages are bullish. This strongly bullish trend is supported by the strong bullish signals given by short-term moving averages. An assessment of moving averages reveals a bullish signal that could impact this trend:
Moving Average bullish crossovers : AMA50 & AMA100
Type : Bullish
Timeframe : Daily
In fact, according to the parameters integrated into the Central Analyzer system, 14 technical indicators out of 18 analysed are currently bullish. But beware of excesses. The Central Indicators scanner currently detects this:
CCI indicator is overbought : over 100
Type : Neutral
Timeframe : Daily
Williams %R indicator is overbought : over -20
Type : Neutral
Timeframe : Daily
Central Patterns, the scanner specializing in chart patterns, did not identify any signals.
The presence of these Japanese chandelier patterns detected by Central Candlesticks that could impact the current short-term trend were also noted:
Bullish harami
Type : Bullish
Timeframe : Daily
Doji
Type : Neutral
Timeframe : Daily
| S3 | S2 | S1 | Price | R1 | R2 | R3 | |
|---|---|---|---|---|---|---|---|
| ProTrendLines | 581.82 | 632.88 | 654.92 | 675.50 | 679.50 | 723.50 | 831.39 |
| Change (%) | -13.87% | -6.31% | -3.05% | - | +0.59% | +7.11% | +23.08% |
| Change | -93.68 | -42.62 | -20.58 | - | +4.00 | +48.00 | +155.89 |
| Level | Intermediate | Intermediate | Major | - | Major | Minor | Minor |
To determine price objectives, it is also possible to use the pivot points. Here is the price position in relation to pivot points:
| Pivot points | S3 | S2 | S1 | PP | R1 | R2 | R3 |
|---|---|---|---|---|---|---|---|
| Standard | 633.25 | 650.50 | 661.50 | 678.75 | 689.75 | 707.00 | 718.00 |
| Camarilla | 664.73 | 667.32 | 669.91 | 672.50 | 675.09 | 677.68 | 680.27 |
| Woodie | 630.13 | 648.94 | 658.38 | 677.19 | 686.63 | 705.44 | 714.88 |
| Fibonacci | 650.50 | 661.29 | 667.96 | 678.75 | 689.54 | 696.21 | 707.00 |
| Pivot points | S3 | S2 | S1 | PP | R1 | R2 | R3 |
|---|---|---|---|---|---|---|---|
| Standard | 571.17 | 590.33 | 626.92 | 646.08 | 682.67 | 701.83 | 738.42 |
| Camarilla | 648.17 | 653.28 | 658.39 | 663.50 | 668.61 | 673.72 | 678.83 |
| Woodie | 579.88 | 594.69 | 635.63 | 650.44 | 691.38 | 706.19 | 747.13 |
| Fibonacci | 590.33 | 611.63 | 624.79 | 646.08 | 667.38 | 680.54 | 701.83 |
| Pivot points | S3 | S2 | S1 | PP | R1 | R2 | R3 |
|---|---|---|---|---|---|---|---|
| Standard | 471.83 | 510.92 | 555.08 | 594.17 | 638.33 | 677.42 | 721.58 |
| Camarilla | 576.36 | 583.99 | 591.62 | 599.25 | 606.88 | 614.51 | 622.14 |
| Woodie | 474.38 | 512.19 | 557.63 | 595.44 | 640.88 | 678.69 | 724.13 |
| Fibonacci | 510.92 | 542.72 | 562.37 | 594.17 | 625.97 | 645.62 | 677.42 |
Numerical data
The following is the status of the technical indicators and moving averages at the time of publication of this technical analysis:
| RSI (14): | 69.52 | |
| MACD (12,26,9): | 24.6500 | |
| Directional Movement: | 24.60 | |
| AROON (14): | 64.29 | |
| DEMA (21): | 660.19 | |
| Parabolic SAR (0,02-0,02-0,2): | 648.80 | |
| Elder Ray (13): | 32.11 | |
| Super Trend (3,10): | 612.25 | |
| Zig ZAG (10): | 674.75 | |
| VORTEX (21): | 1.2500 | |
| Stochastique (14,3,5): | 83.21 | |
| TEMA (21): | 676.26 | |
| Williams %R (14): | -20.24 | |
| Chande Momentum Oscillator (20): | 66.75 | |
| Repulse (5,40,3): | 1.6100 | |
| ROCnROLL: | 1 | |
| TRIX (15,9): | 0.4700 | |
| Courbe Coppock: | 21.30 |
| MA7: | 658.86 | |
| MA20: | 623.27 | |
| MA50: | 587.27 | |
| MA100: | 597.25 | |
| MAexp7: | 660.63 | |
| MAexp20: | 630.77 | |
| MAexp50: | 606.11 | |
| MAexp100: | 604.39 | |
| Price / MA7: | +2.53% | |
| Price / MA20: | +8.38% | |
| Price / MA50: | +15.02% | |
| Price / MA100: | +13.10% | |
| Price / MAexp7: | +2.25% | |
| Price / MAexp20: | +7.09% | |
| Price / MAexp50: | +11.45% | |
| Price / MAexp100: | +11.77% |
News
Don't forget to follow the news on WHEAT. At the time of publication of this analysis, the latest news was as follows:
-
 Trading the trend: short Chicago wheat
-
Trading into 2024: Chicago Wheat and an early possibly entry into Elliot Wave
-
Watch wheat, corn, soy price volatility, rising Black Sea tensions
-
AI – How to sort the ‘wheat from the chaff’
-
Wheat prices soar as Russia bombs Ukraine's grain stores - BBC News
About author

Online


Add a comment
Comments
0 comments on the analysis WHEAT - Daily