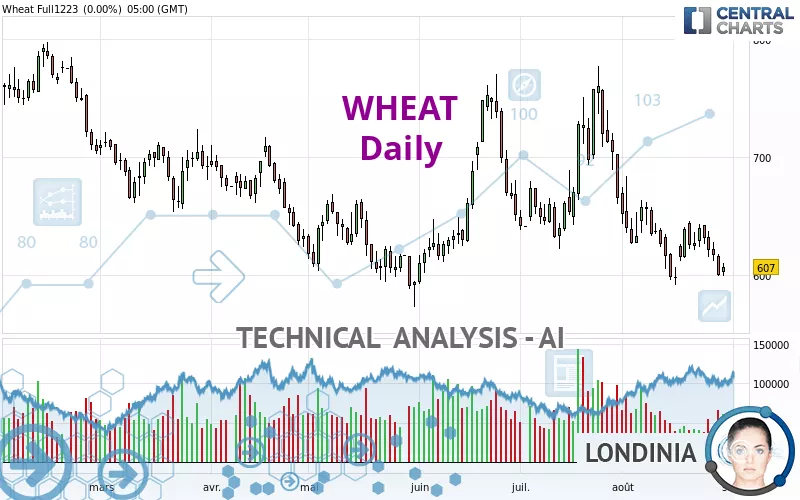
WHEAT - Daily - Technical analysis published on 08/31/2023 (GMT)
- 200
- 0
Click here for a new analysis!
- Timeframe : Daily
- - Analysis generated on
- Status : TARGET REACHED
Summary of the analysis

Additional analysis
Quotes
WHEAT rating 599.00 USD. The price registered a decrease of -1.32% on the session and was between 595.50 USD and 606.50 USD. This implies that the price is at +0.59% from its lowest and at -1.24% from its highest.The Central Gaps scanner detects a bearish opening. A small advantage for sellers in the very short term.
Bearish opening
Type : Bearish
Timeframe : Openning
Here is a more detailed summary of the historical variations registered by WHEAT:
New LOW record (5 years)
Type : Bearish
Timeframe : Weekly
New LOW record (1 year)
Type : Bearish
Timeframe : Weekly
New LOW record (1st january)
Type : Bearish
Timeframe : Weekly
New LOW record (1 month)
Type : Bearish
Timeframe : Weekly
Technical
A technical analysis in Daily of this WHEAT chart shows a sharp bearish trend. 92.86% of the signals given by moving averages are bearish. This strongly bearish trend is supported by the strong bearish signals given by short-term moving averages. An assessment of moving averages reveals a bearish signal that could impact this trend:
Moving Average bearish crossovers : AMA50 & AMA100
Type : Bearish
Timeframe : Daily
In fact, Central Analyzer took into account 18 technical indicators and the result was as follows: 4 are bullish, 2 are neutral and 12 are bearish. Caution: the Central Indicators scanner currently detects an excess:
CCI indicator is oversold : under -100
Type : Neutral
Timeframe : Daily
Williams %R indicator is oversold : under -80
Type : Neutral
Timeframe : Daily
Pivot points : price is under support 1
Type : Neutral
Timeframe : Daily
Pivot points : price is under support 1
Type : Neutral
Timeframe : Weekly
No signals are given by Central Patterns, a market scanner specialised in chart patterns, resistances and supports.
No result was found by the Central Candlesticks scanner on Japanese candlesticks.
| Price | R1 | R2 | R3 | |
|---|---|---|---|---|
| ProTrendLines | 599.00 | 617.42 | 699.79 | 786.50 |
| Change (%) | - | +3.08% | +16.83% | +31.30% |
| Change | - | +18.42 | +100.79 | +187.50 |
| Level | - | Major | Minor | Minor |
Pivot points can also be used to set your price objectives. Here is the price situation in relation to pivot points:
| Pivot points | S3 | S2 | S1 | PP | R1 | R2 | R3 |
|---|---|---|---|---|---|---|---|
| Standard | 589.50 | 594.50 | 600.75 | 605.75 | 612.00 | 617.00 | 623.25 |
| Camarilla | 603.91 | 604.94 | 605.97 | 607.00 | 608.03 | 609.06 | 610.09 |
| Woodie | 590.13 | 594.81 | 601.38 | 606.06 | 612.63 | 617.31 | 623.88 |
| Fibonacci | 594.50 | 598.80 | 601.45 | 605.75 | 610.05 | 612.70 | 617.00 |
| Pivot points | S3 | S2 | S1 | PP | R1 | R2 | R3 |
|---|---|---|---|---|---|---|---|
| Standard | 578.67 | 597.08 | 609.42 | 627.83 | 640.17 | 658.58 | 670.92 |
| Camarilla | 613.29 | 616.11 | 618.93 | 621.75 | 624.57 | 627.39 | 630.21 |
| Woodie | 575.63 | 595.56 | 606.38 | 626.31 | 637.13 | 657.06 | 667.88 |
| Fibonacci | 597.08 | 608.83 | 616.09 | 627.83 | 639.58 | 646.84 | 658.58 |
| Pivot points | S3 | S2 | S1 | PP | R1 | R2 | R3 |
|---|---|---|---|---|---|---|---|
| Standard | 461.42 | 554.83 | 616.67 | 710.08 | 771.92 | 865.33 | 927.17 |
| Camarilla | 635.81 | 650.04 | 664.27 | 678.50 | 692.73 | 706.96 | 721.19 |
| Woodie | 445.63 | 546.94 | 600.88 | 702.19 | 756.13 | 857.44 | 911.38 |
| Fibonacci | 554.83 | 614.14 | 650.78 | 710.08 | 769.39 | 806.03 | 865.33 |
Numerical data
The following are the details of the technical indicators and moving averages that were collected to generate this technical analysis:
| RSI (14): | 35.29 | |
| MACD (12,26,9): | -21.7500 | |
| Directional Movement: | -10.85 | |
| AROON (14): | -100.00 | |
| DEMA (21): | 607.90 | |
| Parabolic SAR (0,02-0,02-0,2): | 623.98 | |
| Elder Ray (13): | -22.88 | |
| Super Trend (3,10): | 660.87 | |
| Zig ZAG (10): | 599.00 | |
| VORTEX (21): | 0.8300 | |
| Stochastique (14,3,5): | 6.00 | |
| TEMA (21): | 597.21 | |
| Williams %R (14): | -94.68 | |
| Chande Momentum Oscillator (20): | -25.75 | |
| Repulse (5,40,3): | -3.0200 | |
| ROCnROLL: | 2 | |
| TRIX (15,9): | -0.4400 | |
| Courbe Coppock: | 12.78 |
| MA7: | 616.79 | |
| MA20: | 635.94 | |
| MA50: | 678.01 | |
| MA100: | 680.56 | |
| MAexp7: | 612.92 | |
| MAexp20: | 635.66 | |
| MAexp50: | 663.40 | |
| MAexp100: | 689.78 | |
| Price / MA7: | -2.88% | |
| Price / MA20: | -5.81% | |
| Price / MA50: | -11.65% | |
| Price / MA100: | -11.98% | |
| Price / MAexp7: | -2.27% | |
| Price / MAexp20: | -5.77% | |
| Price / MAexp50: | -9.71% | |
| Price / MAexp100: | -13.16% |
News
The last news published on WHEAT at the time of the generation of this analysis was as follows:
-
 Watch wheat, corn, soy price volatility, rising Black Sea tensions
-
AI – How to sort the ‘wheat from the chaff’
-
Wheat prices soar as Russia bombs Ukraine's grain stores - BBC News
-
Trading the Trend: short Chicago wheat
-
Trading the Trend: short Chicago wheat
About author

Online


Add a comment
Comments
0 comments on the analysis WHEAT - Daily