WHEAT - Daily - Technical analysis published on 10/06/2022 (GMT)
- 226
- 0
- Timeframe : Daily
- - Analysis generated on
- Status : NEUTRAL
Summary of the analysis

Additional analysis
Quotes
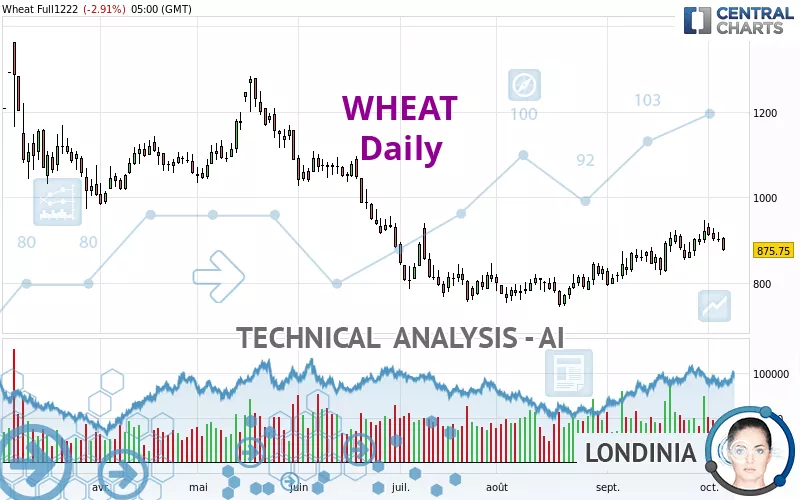
WHEAT rating 875.75 USD. The price is lower by -2.91% since the last closing and was traded between 873.25 USD and 907.75 USD over the period. The price is currently at +0.29% from its lowest and -3.53% from its highest.The Central Gaps scanner detects a bullish opening. A small advantage for buyers in the very short term.
Bullish opening
Type : Bullish
Timeframe : Openning
A study of price movements over other periods shows the following variations:
Near a new HIGH record (1 month)
Type : Bullish
Timeframe : Weekly
Technical
Technical analysis of WHEAT in Daily shows an overall slightly bearish trend. Only 53.57% of the signals given by moving averages are bearish. This slightly bearish trend could return to neutral given the neutral signals also given by short-term moving averages. An assessment of moving averages reveals a bearish signal that could impact this trend:
Bearish price crossover with Moving Average 20
Type : Bearish
Timeframe : Daily
The technical indicators are generally neutral. They do not provide relevant information on the direction of future price movements.
Central Indicators, the scanner specialised in technical indicators, has identified these signals:
Pivot points : price is under support 3
Type : Neutral
Timeframe : Daily
MACD crosses DOWN its Moving Average
Type : Bearish
Timeframe : Daily
Price is back under the pivot point
Type : Bearish
Timeframe : Weekly
Momentum indicator is back under 0
Type : Bearish
Timeframe : Daily
Williams %R indicator is back under -50
Type : Bearish
Timeframe : Daily
The analysis of the price chart with Central Patterns scanners does not return any result.
The Central Candlesticks scanner which studies Japanese candlesticks did not detect anything.
| S3 | S2 | S1 | Price | R1 | R2 | R3 | |
|---|---|---|---|---|---|---|---|
| ProTrendLines | 681.75 | 749.00 | 831.75 | 875.75 | 918.75 | 1,048.17 | 1,159.00 |
| Change (%) | -22.15% | -14.47% | -5.02% | - | +4.91% | +19.69% | +32.34% |
| Change | -194.00 | -126.75 | -44.00 | - | +43.00 | +172.42 | +283.25 |
| Level | Major | Minor | Major | - | Major | Major | Minor |
Attention could also be paid to pivot points to set price objectives:
| Pivot points | S3 | S2 | S1 | PP | R1 | R2 | R3 |
|---|---|---|---|---|---|---|---|
| Standard | 865.42 | 879.83 | 890.92 | 905.33 | 916.42 | 930.83 | 941.92 |
| Camarilla | 894.99 | 897.33 | 899.66 | 902.00 | 904.34 | 906.68 | 909.01 |
| Woodie | 863.75 | 879.00 | 889.25 | 904.50 | 914.75 | 930.00 | 940.25 |
| Fibonacci | 879.83 | 889.57 | 895.59 | 905.33 | 915.07 | 921.09 | 930.83 |
| Pivot points | S3 | S2 | S1 | PP | R1 | R2 | R3 |
|---|---|---|---|---|---|---|---|
| Standard | 777.08 | 815.67 | 868.58 | 907.17 | 960.08 | 998.67 | 1,051.58 |
| Camarilla | 896.34 | 904.73 | 913.11 | 921.50 | 929.89 | 938.28 | 946.66 |
| Woodie | 784.25 | 819.25 | 875.75 | 910.75 | 967.25 | 1,002.25 | 1,058.75 |
| Fibonacci | 815.67 | 850.62 | 872.21 | 907.17 | 942.12 | 963.71 | 998.67 |
| Pivot points | S3 | S2 | S1 | PP | R1 | R2 | R3 |
|---|---|---|---|---|---|---|---|
| Standard | 680.42 | 738.33 | 829.92 | 887.83 | 979.42 | 1,037.33 | 1,128.92 |
| Camarilla | 880.39 | 894.09 | 907.80 | 921.50 | 935.20 | 948.91 | 962.61 |
| Woodie | 697.25 | 746.75 | 846.75 | 896.25 | 996.25 | 1,045.75 | 1,145.75 |
| Fibonacci | 738.33 | 795.44 | 830.72 | 887.83 | 944.94 | 980.22 | 1,037.33 |
Numerical data
The following are the details of the technical indicators and moving averages that were collected to generate this technical analysis:
| RSI (14): | 51.24 | |
| MACD (12,26,9): | 17.1500 | |
| Directional Movement: | 4.00 | |
| AROON (14): | 64.29 | |
| DEMA (21): | 901.99 | |
| Parabolic SAR (0,02-0,02-0,2): | 944.72 | |
| Elder Ray (13): | 2.05 | |
| Super Trend (3,10): | 808.13 | |
| Zig ZAG (10): | 876.25 | |
| VORTEX (21): | 1.0800 | |
| Stochastique (14,3,5): | 59.16 | |
| TEMA (21): | 912.69 | |
| Williams %R (14): | -53.36 | |
| Chande Momentum Oscillator (20): | -15.50 | |
| Repulse (5,40,3): | -5.9500 | |
| ROCnROLL: | -1 | |
| TRIX (15,9): | 0.3300 | |
| Courbe Coppock: | 8.47 |
| MA7: | 902.18 | |
| MA20: | 881.48 | |
| MA50: | 836.96 | |
| MA100: | 919.65 | |
| MAexp7: | 894.52 | |
| MAexp20: | 879.20 | |
| MAexp50: | 869.28 | |
| MAexp100: | 897.57 | |
| Price / MA7: | -2.93% | |
| Price / MA20: | -0.65% | |
| Price / MA50: | +4.63% | |
| Price / MA100: | -4.77% | |
| Price / MAexp7: | -2.10% | |
| Price / MAexp20: | -0.39% | |
| Price / MAexp50: | +0.74% | |
| Price / MAexp100: | -2.43% |
News
Don't forget to follow the news on WHEAT. At the time of publication of this analysis, the latest news was as follows:
-
 Senegal wheat prices create demand for locally-sourced cereals
-
Four Are Dead After An Apparent Murder-Suicide In North Dakota Wheat Field
-
First shipment of wheat out of Ukraine arrives in Africa - BBC News
-
Imran Khan: Pakistan's future is tied up with Russia in terms of gas, oil and specifically wheat
-
Heat waves push India to ban export of wheat | DW News
About author

Online


Add a comment
Comments
0 comments on the analysis WHEAT - Daily