| Open: | 531.75 |
| Change: | -4.50 |
| Volume: | 2,681 |
| Low: | 527.50 |
| High: | 533.00 |
| High / Low range: | 5.50 |
| Type: | Commodities |
| Ticker: | WWY |
| ISIN: |
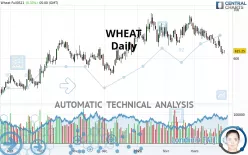
WHEAT - Daily - Technical analysis published on 03/29/2021 (GMT)
- 195
- 0
- 03/29/2021 - 09:49
Click here for a new analysis!
- Timeframe : Daily
- - Analysis generated on 03/29/2021 - 09:49
- Status : INVALID

Summary of the analysis

Additional analysis
Quotes
The WHEAT price is 615.25 USD. The price registered an increase of +0.33% on the session and was traded between 610.25 USD and 616.50 USD over the period. The price is currently at +0.82% from its lowest and -0.20% from its highest.A bullish opening was detected by the Central Gaps scanner. Buyers are trying to impose a bullish momentum in the very short term.
Bullish opening
Type : Bullish
Timeframe : Openning
So that you have an overall view of the price change, here is a table showing the variations over several periods:
Near a new LOW record (1st january)
Type : Bearish
Timeframe : Weekly
Near a new LOW record (1 month)
Type : Bearish
Timeframe : Weekly
Technical
Technical analysis of WHEAT in Daily shows an overall bearish trend. The signals given by moving averages are 67.86% bearish. This bearish trend is reinforced by the strong signals currently being given by short-term moving averages. The Central Indicators market scanner currently does not detect any result that concerns moving averages.
In fact, of the 18 technical indicators analysed by Central Analyzer, 4 are bullish, 4 are neutral and 10 are bearish. But beware of excesses. The Central Indicators scanner currently detects this:
CCI indicator is oversold : under -100
Type : Neutral
Timeframe : Daily
RSI indicator: bullish divergence
Type : Bullish
Timeframe : Daily
Williams %R indicator is oversold : under -80
Type : Neutral
Timeframe : Daily
Pivot points : price is over resistance 3
Type : Neutral
Timeframe : Daily
Pivot points : price is under support 1
Type : Neutral
Timeframe : Weekly
Pivot points : price is under support 3
Type : Neutral
Timeframe : Daily
The analysis of the price chart with Central Patterns scanners does not return any result.
The Central Candlesticks scanner which studies Japanese candlesticks did not detect anything.
| S3 | S2 | S1 | Price | R1 | R2 | R3 | |
|---|---|---|---|---|---|---|---|
| ProTrendLines | 522.50 | 546.75 | 579.87 | 615.25 | 632.90 | 656.12 | 675.50 |
| Change (%) | -15.08% | -11.13% | -5.75% | - | +2.87% | +6.64% | +9.79% |
| Change | -92.75 | -68.50 | -35.38 | - | +17.65 | +40.87 | +60.25 |
| Level | Minor | Minor | Major | - | Major | Minor | Intermediate |
Attention could also be paid to pivot points to set price objectives:
| Pivot points | S3 | S2 | S1 | PP | R1 | R2 | R3 |
|---|---|---|---|---|---|---|---|
| Standard | 597.25 | 602.75 | 608.00 | 613.50 | 618.75 | 624.25 | 629.50 |
| Camarilla | 610.29 | 611.28 | 612.27 | 613.25 | 614.24 | 615.22 | 616.21 |
| Woodie | 597.13 | 602.69 | 607.88 | 613.44 | 618.63 | 624.19 | 629.38 |
| Fibonacci | 602.75 | 606.86 | 609.39 | 613.50 | 617.61 | 620.14 | 624.25 |
| Pivot points | S3 | S2 | S1 | PP | R1 | R2 | R3 |
|---|---|---|---|---|---|---|---|
| Standard | 563.25 | 585.75 | 599.50 | 622.00 | 635.75 | 658.25 | 672.00 |
| Camarilla | 603.28 | 606.60 | 609.93 | 613.25 | 616.57 | 619.90 | 623.22 |
| Woodie | 558.88 | 583.56 | 595.13 | 619.81 | 631.38 | 656.06 | 667.63 |
| Fibonacci | 585.75 | 599.60 | 608.15 | 622.00 | 635.85 | 644.40 | 658.25 |
| Pivot points | S3 | S2 | S1 | PP | R1 | R2 | R3 |
|---|---|---|---|---|---|---|---|
| Standard | 558.42 | 592.08 | 621.17 | 654.83 | 683.92 | 717.58 | 746.67 |
| Camarilla | 632.99 | 638.75 | 644.50 | 650.25 | 656.00 | 661.75 | 667.51 |
| Woodie | 556.13 | 590.94 | 618.88 | 653.69 | 681.63 | 716.44 | 744.38 |
| Fibonacci | 592.08 | 616.05 | 630.86 | 654.83 | 678.80 | 693.61 | 717.58 |
Numerical data
The following are the details of the technical indicators and moving averages that were collected to generate this technical analysis:
| RSI (14): | 37.53 | |
| MACD (12,26,9): | -9.5400 | |
| Directional Movement: | -9.61 | |
| AROON (14): | -92.86 | |
| DEMA (21): | 623.85 | |
| Parabolic SAR (0,02-0,02-0,2): | 642.37 | |
| Elder Ray (13): | -15.64 | |
| Super Trend (3,10): | 655.87 | |
| Zig ZAG (10): | 615.00 | |
| VORTEX (21): | 0.8400 | |
| Stochastique (14,3,5): | 10.35 | |
| TEMA (21): | 614.94 | |
| Williams %R (14): | -85.57 | |
| Chande Momentum Oscillator (20): | -27.25 | |
| Repulse (5,40,3): | -1.2600 | |
| ROCnROLL: | 2 | |
| TRIX (15,9): | -0.1400 | |
| Courbe Coppock: | 9.19 |
| MA7: | 622.18 | |
| MA20: | 639.01 | |
| MA50: | 648.90 | |
| MA100: | 630.04 | |
| MAexp7: | 621.93 | |
| MAexp20: | 634.66 | |
| MAexp50: | 639.58 | |
| MAexp100: | 627.80 | |
| Price / MA7: | -1.11% | |
| Price / MA20: | -3.72% | |
| Price / MA50: | -5.19% | |
| Price / MA100: | -2.35% | |
| Price / MAexp7: | -1.07% | |
| Price / MAexp20: | -3.06% | |
| Price / MAexp50: | -3.80% | |
| Price / MAexp100: | -2.00% |
News
The last news published on WHEAT at the time of the generation of this analysis was as follows:
-
06/18/2019 - 18:39
 New strain of Monsanto GM wheat escapes lab, grows in wild
-
08/24/2018 - 13:16
Trading Wheat. Commodity Brief
-
09/27/2017 - 20:19
Gene-Edited Gluten Makes Wheat For Celiac Disease Sufferers
-
07/06/2017 - 10:46
What’s next for wheat after surge — #SaxoStrats
-
07/04/2017 - 13:18
Are Wheat Prices Sustainable?
About author

Online


Add a comment
Comments
0 comments on the analysis WHEAT - Daily