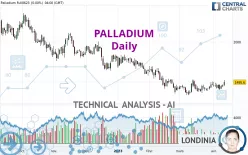
PALLADIUM - Daily - Technical analysis published on 04/14/2023 (GMT)
- 322
- 0
Click here for a new analysis!
- Timeframe : Daily
- - Analysis generated on
- Status : TARGET REACHED

Summary of the analysis

Additional analysis
Quotes
The PALLADIUM price is 1,513.00 USD. The price registered an increase of +1.16% on the session and was traded between 1,505.00 USD and 1,517.50 USD over the period. The price is currently at +0.53% from its lowest and -0.30% from its highest.A bullish opening was detected by the Central Gaps scanner. Buyers are trying to impose a bullish momentum in the very short term.
Bullish opening
Type : Bullish
Timeframe : Openning
Here is a more detailed summary of the historical variations registered by PALLADIUM:
Near a new HIGH record (1 month)
Type : Bullish
Timeframe : Weekly
Technical
Technical analysis of PALLADIUM in Daily shows an overall slightly bearish trend. 57.14% of the signals given by moving averages are bearish. Caution: the strong bullish signals currently being given by short-term moving averages could quickly lead to a reversal of the trend. The Central Indicators market scanner is currently detecting several bullish signals that could impact this trend:
Bullish trend reversal : Moving Average 20
Type : Bullish
Timeframe : Daily
Bullish trend reversal : adaptative moving average 50
Type : Bullish
Timeframe : Daily
In fact, according to the parameters integrated into the Central Analyzer system, 15 technical indicators out of 18 analysed are currently bullish. But beware of excesses. The Central Indicators scanner currently detects this:
CCI indicator is overbought : over 100
Type : Neutral
Timeframe : Daily
Williams %R indicator is overbought : over -20
Type : Neutral
Timeframe : Daily
Pivot points : price is over resistance 1
Type : Neutral
Timeframe : Weekly
MACD indicator is back over 0
Type : Bullish
Timeframe : Daily
Central Patterns, the scanner specializing in chart patterns, did not identify any signals.
No result was found by the Central Candlesticks scanner on Japanese candlesticks.
| S3 | S2 | S1 | Price | R1 | R2 | R3 | |
|---|---|---|---|---|---|---|---|
| ProTrendLines | 1,155.14 | 1,362.10 | 1,462.79 | 1,513.00 | 1,622.75 | 1,812.03 | 1,999.27 |
| Change (%) | -23.65% | -9.97% | -3.32% | - | +7.25% | +19.76% | +32.14% |
| Change | -357.86 | -150.90 | -50.21 | - | +109.75 | +299.03 | +486.27 |
| Level | Minor | Major | Major | - | Minor | Intermediate | Intermediate |
To determine price objectives, it is also possible to use the pivot points. Here is the price position in relation to pivot points:
| Pivot points | S3 | S2 | S1 | PP | R1 | R2 | R3 |
|---|---|---|---|---|---|---|---|
| Standard | 1,379.33 | 1,412.17 | 1,458.83 | 1,491.67 | 1,538.33 | 1,571.17 | 1,617.83 |
| Camarilla | 1,483.64 | 1,490.93 | 1,498.21 | 1,505.50 | 1,512.79 | 1,520.08 | 1,527.36 |
| Woodie | 1,386.25 | 1,415.63 | 1,465.75 | 1,495.13 | 1,545.25 | 1,574.63 | 1,624.75 |
| Fibonacci | 1,412.17 | 1,442.54 | 1,461.30 | 1,491.67 | 1,522.04 | 1,540.80 | 1,571.17 |
| Pivot points | S3 | S2 | S1 | PP | R1 | R2 | R3 |
|---|---|---|---|---|---|---|---|
| Standard | 1,323.60 | 1,365.80 | 1,414.10 | 1,456.30 | 1,504.60 | 1,546.80 | 1,595.10 |
| Camarilla | 1,437.51 | 1,445.81 | 1,454.10 | 1,462.40 | 1,470.70 | 1,478.99 | 1,487.29 |
| Woodie | 1,326.65 | 1,367.33 | 1,417.15 | 1,457.83 | 1,507.65 | 1,548.33 | 1,598.15 |
| Fibonacci | 1,365.80 | 1,400.37 | 1,421.73 | 1,456.30 | 1,490.87 | 1,512.23 | 1,546.80 |
| Pivot points | S3 | S2 | S1 | PP | R1 | R2 | R3 |
|---|---|---|---|---|---|---|---|
| Standard | 1,157.67 | 1,245.33 | 1,356.67 | 1,444.33 | 1,555.67 | 1,643.33 | 1,754.67 |
| Camarilla | 1,413.28 | 1,431.52 | 1,449.76 | 1,468.00 | 1,486.24 | 1,504.48 | 1,522.73 |
| Woodie | 1,169.50 | 1,251.25 | 1,368.50 | 1,450.25 | 1,567.50 | 1,649.25 | 1,766.50 |
| Fibonacci | 1,245.33 | 1,321.35 | 1,368.32 | 1,444.33 | 1,520.35 | 1,567.32 | 1,643.33 |
Numerical data
The following is the status of technical indicators and moving averages registered at the time this technical analysis was created:
| RSI (14): | 57.88 | |
| MACD (12,26,9): | 4.4600 | |
| Directional Movement: | 7.16 | |
| AROON (14): | 92.86 | |
| DEMA (21): | 1,451.66 | |
| Parabolic SAR (0,02-0,02-0,2): | 1,363.78 | |
| Elder Ray (13): | 52.86 | |
| Super Trend (3,10): | 1,554.32 | |
| Zig ZAG (10): | 1,512.00 | |
| VORTEX (21): | 1.0700 | |
| Stochastique (14,3,5): | 78.90 | |
| TEMA (21): | 1,483.86 | |
| Williams %R (14): | -9.06 | |
| Chande Momentum Oscillator (20): | 97.30 | |
| Repulse (5,40,3): | 2.7400 | |
| ROCnROLL: | -1 | |
| TRIX (15,9): | -0.0600 | |
| Courbe Coppock: | 6.68 |
| MA7: | 1,458.90 | |
| MA20: | 1,438.81 | |
| MA50: | 1,465.51 | |
| MA100: | 1,628.29 | |
| MAexp7: | 1,472.03 | |
| MAexp20: | 1,453.24 | |
| MAexp50: | 1,496.87 | |
| MAexp100: | 1,610.36 | |
| Price / MA7: | +3.71% | |
| Price / MA20: | +5.16% | |
| Price / MA50: | +3.24% | |
| Price / MA100: | -7.08% | |
| Price / MAexp7: | +2.78% | |
| Price / MAexp20: | +4.11% | |
| Price / MAexp50: | +1.08% | |
| Price / MAexp100: | -6.05% |
News
The last news published on PALLADIUM at the time of the generation of this analysis was as follows:
-
 Will palladium continue to drive higher? – 27 November 2020
-
Will palladium set a new record high? – 6th February 2020
-
“Buzz on the Street” Show: Palladium One Mining (TSX-V: PDM) (OTC: NKORF) News Report
-
Will palladium retest the recent all time high? – 21st November 2019
-
Will palladium see a pullback in the near term? – 17th October 2019
About author

Online


Add a comment
Comments
0 comments on the analysis PALLADIUM - Daily