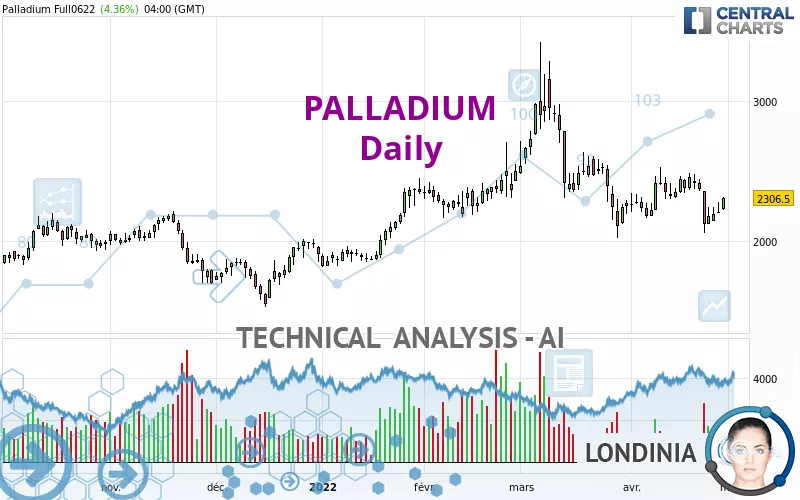
PALLADIUM - Daily - Technical analysis published on 04/29/2022 (GMT)
- 316
- 0
Click here for a new analysis!
- Timeframe : Daily
- - Analysis generated on
- Status : TARGET REACHED
Summary of the analysis

Additional analysis
Quotes
The PALLADIUM price is 2,306.50 USD. The price has increased by +4.36% since the last closing and was traded between 2,227.00 USD and 2,316.00 USD over the period. The price is currently at +3.57% from its lowest and -0.41% from its highest.The Central Gaps scanner detects a bullish opening marking the presence of buyers ahead of sellers at the opening but not sufficiently marked to allow the price to register a quotation gap.
Bullish opening
Type : Bullish
Timeframe : Openning
So that you have an overall view of the price change, here is a table showing the variations over several periods:
Technical
Technical analysis of PALLADIUM in Daily shows an overall slightly bearish trend. 60.71% of the signals given by moving averages are bearish. The overall trend remains fragile, reflecting the slightly bearish signals given by short-term moving averages. The Central Indicators market scanner is currently detecting several bullish signals that could impact this trend:
Bullish price crossover with Moving Average 100
Type : Bullish
Timeframe : Daily
Bullish price crossover with adaptative moving average 100
Type : Bullish
Timeframe : Daily
An assessment of technical indicators does not currently provide any relevant information on the direction of future price movements.
Caution: the Central Indicators scanner currently detects an excess:
MACD indicator: bullish divergence
Type : Bullish
Timeframe : Daily
Pivot points : price is over resistance 1
Type : Neutral
Timeframe : Daily
Pivot points : price is under support 1
Type : Neutral
Timeframe : Weekly
No signals are given by Central Patterns, a market scanner specialised in chart patterns, resistances and supports.
No result was found by the Central Candlesticks scanner on Japanese candlesticks.
| S3 | S2 | S1 | Price | R1 | R2 | R3 | |
|---|---|---|---|---|---|---|---|
| ProTrendLines | 1,836.54 | 2,020.00 | 2,227.90 | 2,306.50 | 2,396.94 | 2,541.39 | 2,740.49 |
| Change (%) | -20.38% | -12.42% | -3.41% | - | +3.92% | +10.18% | +18.82% |
| Change | -469.96 | -286.50 | -78.60 | - | +90.44 | +234.89 | +433.99 |
| Level | Intermediate | Minor | Major | - | Intermediate | Intermediate | Major |
To determine price objectives, it is also possible to use the pivot points. Here is the price position in relation to pivot points:
| Pivot points | S3 | S2 | S1 | PP | R1 | R2 | R3 |
|---|---|---|---|---|---|---|---|
| Standard | 2,098.40 | 2,150.70 | 2,180.40 | 2,232.70 | 2,262.40 | 2,314.70 | 2,344.40 |
| Camarilla | 2,187.55 | 2,195.07 | 2,202.58 | 2,210.10 | 2,217.62 | 2,225.13 | 2,232.65 |
| Woodie | 2,087.10 | 2,145.05 | 2,169.10 | 2,227.05 | 2,251.10 | 2,309.05 | 2,333.10 |
| Fibonacci | 2,150.70 | 2,182.02 | 2,201.38 | 2,232.70 | 2,264.02 | 2,283.38 | 2,314.70 |
| Pivot points | S3 | S2 | S1 | PP | R1 | R2 | R3 |
|---|---|---|---|---|---|---|---|
| Standard | 2,171.87 | 2,258.43 | 2,317.37 | 2,403.93 | 2,462.87 | 2,549.43 | 2,608.37 |
| Camarilla | 2,336.29 | 2,349.63 | 2,362.96 | 2,376.30 | 2,389.64 | 2,402.98 | 2,416.31 |
| Woodie | 2,158.05 | 2,251.53 | 2,303.55 | 2,397.03 | 2,449.05 | 2,542.53 | 2,594.55 |
| Fibonacci | 2,258.43 | 2,314.01 | 2,348.35 | 2,403.93 | 2,459.51 | 2,493.85 | 2,549.43 |
| Pivot points | S3 | S2 | S1 | PP | R1 | R2 | R3 |
|---|---|---|---|---|---|---|---|
| Standard | 320.83 | 1,173.17 | 1,720.33 | 2,572.67 | 3,119.83 | 3,972.17 | 4,519.33 |
| Camarilla | 1,882.64 | 2,010.93 | 2,139.21 | 2,267.50 | 2,395.79 | 2,524.08 | 2,652.36 |
| Woodie | 168.25 | 1,096.88 | 1,567.75 | 2,496.38 | 2,967.25 | 3,895.88 | 4,366.75 |
| Fibonacci | 1,173.17 | 1,707.78 | 2,038.06 | 2,572.67 | 3,107.28 | 3,437.56 | 3,972.17 |
Numerical data
The following are the details of the technical indicators and moving averages that were collected to generate this technical analysis:
| RSI (14): | 48.00 | |
| MACD (12,26,9): | -43.6800 | |
| Directional Movement: | -5.60 | |
| AROON (14): | -64.29 | |
| DEMA (21): | 2,257.73 | |
| Parabolic SAR (0,02-0,02-0,2): | 2,497.09 | |
| Elder Ray (13): | -27.77 | |
| Super Trend (3,10): | 2,624.30 | |
| Zig ZAG (10): | 2,300.00 | |
| VORTEX (21): | 1.0200 | |
| Stochastique (14,3,5): | 37.55 | |
| TEMA (21): | 2,236.99 | |
| Williams %R (14): | -45.85 | |
| Chande Momentum Oscillator (20): | -38.30 | |
| Repulse (5,40,3): | 2.1200 | |
| ROCnROLL: | -1 | |
| TRIX (15,9): | -0.2400 | |
| Courbe Coppock: | 1.93 |
| MA7: | 2,258.97 | |
| MA20: | 2,307.83 | |
| MA50: | 2,442.21 | |
| MA100: | 2,246.81 | |
| MAexp7: | 2,266.29 | |
| MAexp20: | 2,313.31 | |
| MAexp50: | 2,343.77 | |
| MAexp100: | 2,308.56 | |
| Price / MA7: | +2.10% | |
| Price / MA20: | -0.06% | |
| Price / MA50: | -5.56% | |
| Price / MA100: | +2.66% | |
| Price / MAexp7: | +1.77% | |
| Price / MAexp20: | -0.29% | |
| Price / MAexp50: | -1.59% | |
| Price / MAexp100: | -0.09% |
News
The latest news and videos published on PALLADIUM at the time of the analysis were as follows:
-
 Will palladium continue to drive higher? – 27 November 2020
-
Will palladium set a new record high? – 6th February 2020
-
“Buzz on the Street” Show: Palladium One Mining (TSX-V: PDM) (OTC: NKORF) News Report
-
Will palladium retest the recent all time high? – 21st November 2019
-
Will palladium see a pullback in the near term? – 17th October 2019
About author

Online


Add a comment
Comments
0 comments on the analysis PALLADIUM - Daily