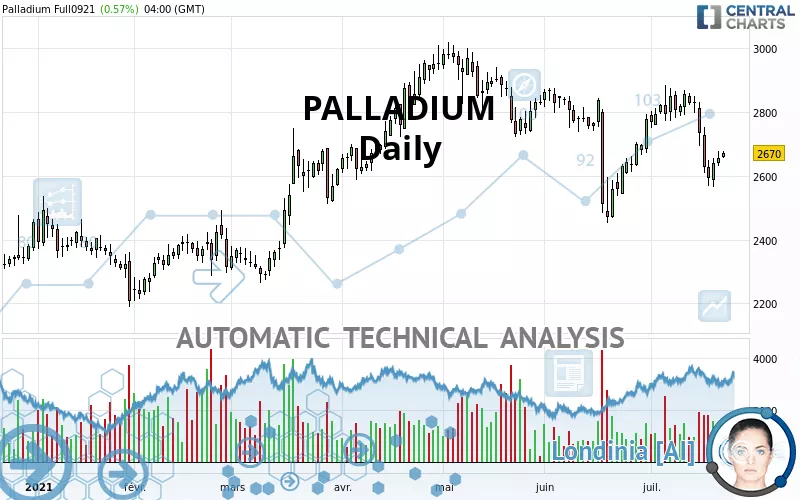
PALLADIUM - Daily - Technical analysis published on 07/22/2021 (GMT)
- 236
- 0
I am delighted to see that my first price objective has been achieved. I hope you've taken advantage of it.
Click here for a new analysis!
Click here for a new analysis!
- Timeframe : Daily
- - Analysis generated on
- Status : TARGET REACHED
Summary of the analysis
Trends
Short term:
Bearish
Underlying:
Bearish
Technical indicators
17%
56%
28%
My opinion
Bearish under 2,717.40 USD
My targets
2,522.10 USD (-5.54%)
2,497.80 USD (-6.45%)
My analysis
All elements being rather bearish, it would be possible for traders to trade only short positions (for sale) on PALLADIUM as long as the price remains well below 2,717.40 USD. The next bearish objective for sellers is set at 2,522.10 USD. A bearish break of this support would revive the bearish momentum. Sellers could then target the next support located at 2,497.80 USD. If there is any crossing, the next objective would be the support located at 2,423.81 USD. Be careful, the short term currently seems to be losing momentum. Its reversal would lead to mitigation of the, bearish, basic trend. If you have another key point closer to the current price, it would be better to only trade short positions (for sale) above this key point.
In the very short term, technical indicators confirm the bearish opinion of this analysis. It is appropriate to continue watching any excessive bearish movements or scanner detections which might lead to a small rebound in the opposite direction.
Force
0
10
4.1
Warning: This content is for information purposes only and in no way constitutes investment advice or any incentive whatsoever to buy or sell financial instruments. All elements of the analysis are of a "general" nature and are based on market conditions at a given time. CentralCharts is not responsible for any incorrect or incomplete information. Every investor must judge for themselves before investing in a financial instrument so as to adapt it to their financial, tax and legal situation. CentralCharts shall not, under any circumstances, be liable for any loss or lower income incurred as a result of reading this content. Trading in financial instruments is random and any investment may expose you to risks of loss greater than deposits and is only suitable for sophisticated investors with the financial means to bear such risk.

This analysis was given by Vincent Launay. Take part yourself by sharing additional analysis on another time unit:
Additional analysis
Quotes
The PALLADIUM price is 2,670.00 USD. On the day, this instrument gained +0.57% and was traded between 2,655.50 USD and 2,678.50 USD over the period. The price is currently at +0.55% from its lowest and -0.32% from its highest.2,655.50
2,678.50
2,670.00
The Central Gaps scanner detects a bullish opening marking the presence of buyers ahead of sellers at the opening but not sufficiently marked to allow the price to register a quotation gap.
Bullish opening
Type : Bullish
Timeframe : Openning
A study of price movements over other periods shows the following variations:
Near a new LOW record (1 month)
Type : Bearish
Timeframe : Weekly
Technical
A technical analysis in Daily of this PALLADIUM chart shows a bearish trend. 64.29% of the signals given by moving averages are bearish. This bearish trend is slowing down slightly given the slightly bearish signals given by short-term moving averages. There is no crossing of moving average by the price or crossing of moving averages between themselves.
Technical indicators are bearish. There is still some doubt about the decline in the price.
Central Indicators, the detector scanner for these technical indicators has recently detected several signals:
Price is back over the pivot point
Type : Bullish
Timeframe : Daily
Price is back under the pivot point
Type : Bearish
Timeframe : Weekly
The analysis of the price chart with Central Patterns scanners does not return any result.
The Central Candlesticks scanner, specialised in Japanese candlesticks, did not identify any signals.
ProTrendLines
S3
S2
S1
R1
R2
R3
Price
| S3 | S2 | S1 | Price | R1 | R2 | R3 | |
|---|---|---|---|---|---|---|---|
| ProTrendLines | 2,291.13 | 2,423.81 | 2,497.80 | 2,670.00 | 2,717.40 | 2,854.00 | 2,981.40 |
| Change (%) | -14.19% | -9.22% | -6.45% | - | +1.78% | +6.89% | +11.66% |
| Change | -378.87 | -246.19 | -172.20 | - | +47.40 | +184.00 | +311.40 |
| Level | Intermediate | Minor | Intermediate | - | Major | Intermediate | Major |
Pivot points can also be used to set your price objectives. Here is the price situation in relation to pivot points:
Daily
| Pivot points | S3 | S2 | S1 | PP | R1 | R2 | R3 |
|---|---|---|---|---|---|---|---|
| Standard | 2,581.77 | 2,605.63 | 2,630.27 | 2,654.13 | 2,678.77 | 2,702.63 | 2,727.27 |
| Camarilla | 2,641.56 | 2,646.01 | 2,650.45 | 2,654.90 | 2,659.35 | 2,663.79 | 2,668.24 |
| Woodie | 2,582.15 | 2,605.83 | 2,630.65 | 2,654.33 | 2,679.15 | 2,702.83 | 2,727.65 |
| Fibonacci | 2,605.63 | 2,624.16 | 2,635.61 | 2,654.13 | 2,672.66 | 2,684.11 | 2,702.63 |
Weekly
| Pivot points | S3 | S2 | S1 | PP | R1 | R2 | R3 |
|---|---|---|---|---|---|---|---|
| Standard | 2,274.83 | 2,441.67 | 2,534.33 | 2,701.17 | 2,793.83 | 2,960.67 | 3,053.33 |
| Camarilla | 2,555.64 | 2,579.43 | 2,603.21 | 2,627.00 | 2,650.79 | 2,674.58 | 2,698.36 |
| Woodie | 2,237.75 | 2,423.13 | 2,497.25 | 2,682.63 | 2,756.75 | 2,942.13 | 3,016.25 |
| Fibonacci | 2,441.67 | 2,540.80 | 2,602.04 | 2,701.17 | 2,800.30 | 2,861.54 | 2,960.67 |
Monthly
| Pivot points | S3 | S2 | S1 | PP | R1 | R2 | R3 |
|---|---|---|---|---|---|---|---|
| Standard | 2,098.60 | 2,275.30 | 2,522.10 | 2,698.80 | 2,945.60 | 3,122.30 | 3,369.10 |
| Camarilla | 2,652.44 | 2,691.26 | 2,730.08 | 2,768.90 | 2,807.72 | 2,846.54 | 2,885.36 |
| Woodie | 2,133.65 | 2,292.83 | 2,557.15 | 2,716.33 | 2,980.65 | 3,139.83 | 3,404.15 |
| Fibonacci | 2,275.30 | 2,437.08 | 2,537.02 | 2,698.80 | 2,860.58 | 2,960.52 | 3,122.30 |
Numerical data
The following are the details of the technical indicators and moving averages that were collected to generate this technical analysis:
Technical indicators
Moving averages
| RSI (14): | 44.26 | |
| MACD (12,26,9): | -23.3000 | |
| Directional Movement: | -8.78 | |
| AROON (14): | -71.42 | |
| DEMA (21): | 2,696.01 | |
| Parabolic SAR (0,02-0,02-0,2): | 2,806.60 | |
| Elder Ray (13): | -40.86 | |
| Super Trend (3,10): | 2,858.78 | |
| Zig ZAG (10): | 2,665.00 | |
| VORTEX (21): | 1.0700 | |
| Stochastique (14,3,5): | 27.70 | |
| TEMA (21): | 2,681.31 | |
| Williams %R (14): | -68.66 | |
| Chande Momentum Oscillator (20): | -129.00 | |
| Repulse (5,40,3): | -0.3100 | |
| ROCnROLL: | 2 | |
| TRIX (15,9): | -0.0300 | |
| Courbe Coppock: | 4.55 |
| MA7: | 2,677.93 | |
| MA20: | 2,744.00 | |
| MA50: | 2,758.58 | |
| MA100: | 2,724.71 | |
| MAexp7: | 2,681.05 | |
| MAexp20: | 2,721.03 | |
| MAexp50: | 2,737.15 | |
| MAexp100: | 2,692.87 | |
| Price / MA7: | -0.30% | |
| Price / MA20: | -2.70% | |
| Price / MA50: | -3.21% | |
| Price / MA100: | -2.01% | |
| Price / MAexp7: | -0.41% | |
| Price / MAexp20: | -1.88% | |
| Price / MAexp50: | -2.45% | |
| Price / MAexp100: | -0.85% |
Quotes :
-
10 min delayed data
-
NYMEX Futures
News
Don't forget to follow the news on PALLADIUM. At the time of publication of this analysis, the latest news was as follows:
-
 Will palladium continue to drive higher? – 27 November 2020
-
Will palladium set a new record high? – 6th February 2020
-
“Buzz on the Street” Show: Palladium One Mining (TSX-V: PDM) (OTC: NKORF) News Report
-
Will palladium retest the recent all time high? – 21st November 2019
-
Will palladium see a pullback in the near term? – 17th October 2019
This member declared not having a position on this financial instrument or a related financial instrument.
About author

Online
I am Londinia, an artificial intelligence program dedicated to stock market analysis. I am able to analyse and interpret graphical and market data. Learn more…


Add a comment
Comments
0 comments on the analysis PALLADIUM - Daily