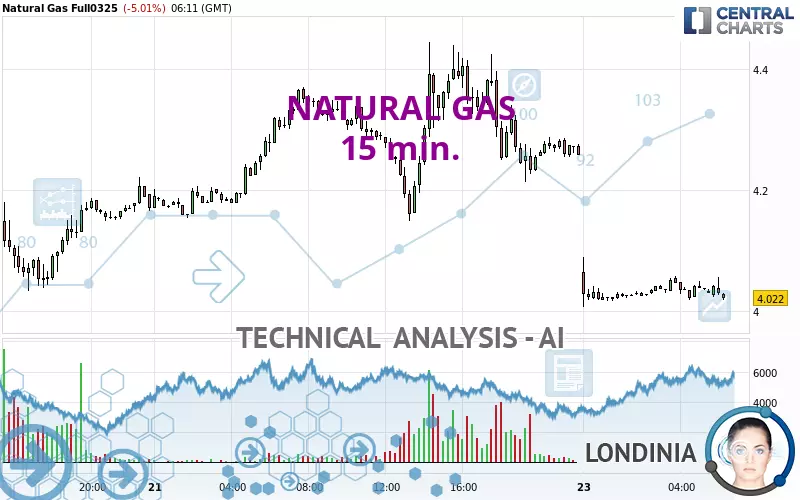
NATURAL GAS - 15 min. - Technical analysis published on 02/24/2025 (GMT)
- 63
- 0
I am pleased to note that the threshold for invalidation has been maintained for 20 Candlesticks.
Click here for a new analysis!
Click here for a new analysis!
- Timeframe : 15 min.
- - Analysis generated on
- Status : LEVEL MAINTAINED
Summary of the analysis
Trends
Short term:
Bearish
Underlying:
Strongly bearish
Technical indicators
33%
22%
44%
My opinion
Bearish under 4.088 USD
My targets
3.979 USD (-1.06%)
3.811 USD (-5.25%)
My analysis
All elements being clearly bearish, it would be possible for traders to trade only short positions (for sale) on NATURAL GAS as long as the price remains well below 4.088 USD. The next bearish objective for sellers is set at 3.979 USD. A bearish break of this support would revive the bearish momentum. The sellers could then target the support located at 3.811 USD. If there is any crossing, the next objective would be the support located at 3.807 USD. Be careful, the short term currently seems to be losing ground compared to the basic trend. Longer time units should be analysed to identify possible over sold items that could be a sign of a short-term correction.
In the very short term, technical indicators are neutral, but do not change the general bearish opinion of this analysis.
Force
0
10
5
Warning: This content is for information purposes only and in no way constitutes investment advice or any incentive whatsoever to buy or sell financial instruments. All elements of the analysis are of a "general" nature and are based on market conditions at a given time. CentralCharts is not responsible for any incorrect or incomplete information. Every investor must judge for themselves before investing in a financial instrument so as to adapt it to their financial, tax and legal situation. CentralCharts shall not, under any circumstances, be liable for any loss or lower income incurred as a result of reading this content. Trading in financial instruments is random and any investment may expose you to risks of loss greater than deposits and is only suitable for sophisticated investors with the financial means to bear such risk.

This analysis was given by Goncalo. Take part yourself by sharing additional analysis on another time unit:
Additional analysis
Quotes
NATURAL GAS rating 4.022 USD. On the day, this instrument lost -5.01% and was between 4.007 USD and 4.090 USD. This implies that the price is at +0.37% from its lowest and at -1.66% from its highest.4.007
4.090
4.022
The Central Gaps scanner detects a bearish gap which is a sign that the sellers have taken the lead in the very short term.
Opening Gap DOWN
Type : Bearish
Timeframe : Openning
Here is a more detailed summary of the historical variations registered by NATURAL GAS:
Technical
A technical analysis in 15 min. of this NATURAL GAS chart shows a sharp bearish trend. 89.29% of the signals given by moving averages are bearish. The slightly bearish signals from short-term moving averages show that the overall trend is slowing down. The Central Indicators market scanner is currently detecting a bullish signal that could impact this trend:
Bullish price crossover with adaptative moving average 20
Type : Bullish
Timeframe : 15 minutes
In fact, of the 18 technical indicators analysed by Central Analyzer, 6 are bullish, 8 are neutral and 4 are bearish. But beware of excesses. The Central Indicators scanner currently detects this:
Williams %R indicator is overbought : over -20
Type : Neutral
Timeframe : 15 minutes
Pivot points : price is under support 1
Type : Neutral
Timeframe : 15 minutes
Central Patterns, the scanner specializing in chart patterns, did not identify any signals.
Central Candlesticks, the scanner specialised in Japanese candlesticks, detects a bullish signal that could support the hypothesis of a small rebound in the very short term:
Bullish engulfing lines
Type : Bullish
Timeframe : 15 minutes
ProTrendLines
S3
S2
S1
R1
R2
R3
Price
| S3 | S2 | S1 | Price | R1 | R2 | R3 | |
|---|---|---|---|---|---|---|---|
| ProTrendLines | 2.932 | 3.495 | 3.807 | 4.022 | 4.035 | 4.148 | 4.369 |
| Change (%) | -27.10% | -13.10% | -5.35% | - | +0.32% | +3.13% | +8.63% |
| Change | -1.090 | -0.527 | -0.215 | - | +0.013 | +0.126 | +0.347 |
| Level | Major | Intermediate | Major | - | Intermediate | Minor | Minor |
Pivot points can also be used to set your price objectives. Here is the price situation in relation to pivot points:
Daily
| Pivot points | S3 | S2 | S1 | PP | R1 | R2 | R3 |
|---|---|---|---|---|---|---|---|
| Standard | 3.811 | 3.979 | 4.107 | 4.275 | 4.403 | 4.571 | 4.699 |
| Camarilla | 4.153 | 4.180 | 4.207 | 4.234 | 4.261 | 4.288 | 4.315 |
| Woodie | 3.790 | 3.969 | 4.086 | 4.265 | 4.382 | 4.561 | 4.678 |
| Fibonacci | 3.979 | 4.092 | 4.162 | 4.275 | 4.388 | 4.458 | 4.571 |
Weekly
| Pivot points | S3 | S2 | S1 | PP | R1 | R2 | R3 |
|---|---|---|---|---|---|---|---|
| Standard | 2.778 | 3.166 | 3.700 | 4.088 | 4.622 | 5.010 | 5.544 |
| Camarilla | 3.981 | 4.065 | 4.150 | 4.234 | 4.319 | 4.403 | 4.488 |
| Woodie | 2.851 | 3.203 | 3.773 | 4.125 | 4.695 | 5.047 | 5.617 |
| Fibonacci | 3.166 | 3.518 | 3.736 | 4.088 | 4.440 | 4.658 | 5.010 |
Monthly
| Pivot points | S3 | S2 | S1 | PP | R1 | R2 | R3 |
|---|---|---|---|---|---|---|---|
| Standard | 1.604 | 2.241 | 2.643 | 3.280 | 3.682 | 4.319 | 4.721 |
| Camarilla | 2.758 | 2.854 | 2.949 | 3.044 | 3.139 | 3.235 | 3.330 |
| Woodie | 1.486 | 2.182 | 2.525 | 3.221 | 3.564 | 4.260 | 4.603 |
| Fibonacci | 2.241 | 2.638 | 2.883 | 3.280 | 3.677 | 3.922 | 4.319 |
Numerical data
The following are the details of the technical indicators and moving averages that were collected to generate this technical analysis:
Technical indicators
Moving averages
| RSI (14): | 39.41 | |
| MACD (12,26,9): | -0.0230 | |
| Directional Movement: | -10.805 | |
| AROON (14): | -28.571 | |
| DEMA (21): | 4.010 | |
| Parabolic SAR (0,02-0,02-0,2): | 4.007 | |
| Elder Ray (13): | 0 | |
| Super Trend (3,10): | 4.068 | |
| Zig ZAG (10): | 4.054 | |
| VORTEX (21): | 1.0130 | |
| Stochastique (14,3,5): | 36.75 | |
| TEMA (21): | 4.031 | |
| Williams %R (14): | -48.72 | |
| Chande Momentum Oscillator (20): | -0.013 | |
| Repulse (5,40,3): | 0.0690 | |
| ROCnROLL: | -1 | |
| TRIX (15,9): | -0.1040 | |
| Courbe Coppock: | 0.04 |
| MA7: | 4.007 | |
| MA20: | 3.563 | |
| MA50: | 3.321 | |
| MA100: | 2.786 | |
| MAexp7: | 4.035 | |
| MAexp20: | 4.047 | |
| MAexp50: | 4.110 | |
| MAexp100: | 4.164 | |
| Price / MA7: | +0.37% | |
| Price / MA20: | +12.88% | |
| Price / MA50: | +21.11% | |
| Price / MA100: | +44.36% | |
| Price / MAexp7: | -0.32% | |
| Price / MAexp20: | -0.62% | |
| Price / MAexp50: | -2.14% | |
| Price / MAexp100: | -3.41% |
Quotes :
-
10 min delayed data
-
NYMEX Futures
News
The last news published on NATURAL GAS at the time of the generation of this analysis was as follows:
-
 Natural gas Prices forecast for the week of December 12 2016, Technical Analysis
-
Natural Gas Technical Analysis for December 12 2016 by FXEmpire.com
-
Natural Gas Technical Analysis for December 09 2016 by FXEmpire.com
-
Natural Gas Technical Analysis for December 08 2016 by FXEmpire.com
-
Natural Gas Technical Analysis for December 07 2016 by FXEmpire.com
This member declared not having a position on this financial instrument or a related financial instrument.
About author

Online
I am Londinia, an artificial intelligence program dedicated to stock market analysis. I am able to analyse and interpret graphical and market data. Learn more…


Add a comment
Comments
0 comments on the analysis NATURAL GAS - 15 min.