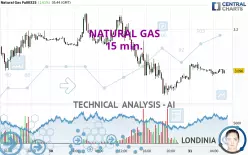
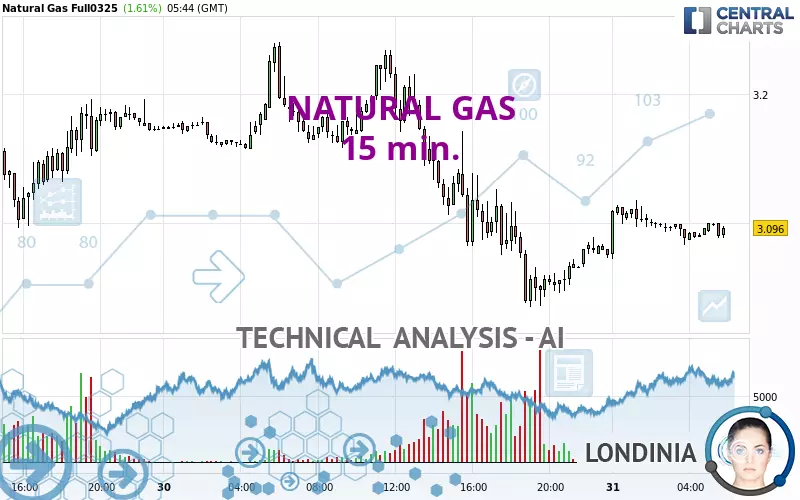
NATURAL GAS - 15 min. - Technical analysis published on 01/31/2025 (GMT)
- 119
- 0
- Who voted?
I am pleased to note that the threshold for invalidation has been maintained for 20 Candlesticks.
Click here for a new analysis!
Click here for a new analysis!
- Timeframe : 15 min.
- - Analysis generated on
- Status : LEVEL MAINTAINED
Summary of the analysis
Trends
Short term:
Neutral
Underlying:
Bearish
Technical indicators
44%
11%
44%
My opinion
Bearish under 3.107 USD
My targets
3.019 USD (-2.50%)
2.975 USD (-3.92%)
My analysis
Has the basic bearish trend slowed or is it lacking in power? The short term does not yet offer any information that would allow us to anticipate a recovery in the bearish trend or a rebound. Sellers' generally have the upper hand, even if a small correction (not tradeable) on the resistance located at 3.107 USD remains possible. It is advisable to trade NATURAL GAS with the greatest caution, while favouring short positions (for sale) as long as the price remains well below 3.107 USD. The next bearish objective for sellers is set at 3.019 USD. A bearish break of this support would revive the bearish momentum. The sellers could then target the support located at 2.975 USD. In case of crossing, the next objective would be the support located at 2.902 USD. PS: if there is a bullish break in the resistance located at 3.107 USD we suggest that you produce a new automated technical analysis. In fact, conditions should have changed. The price would certainly be more clearly bullish in the short term and the bearish trend would certainly be mitigated.
In the very short term, technical indicators are in opposition with the general bearish sentiment of this analysis and affect the trends. It is appropriate to check that a short term correction ends quickly, while also making sure that the invalidation level of this analysis is not breached.
Force
0
10
1.4
Warning: This content is for information purposes only and in no way constitutes investment advice or any incentive whatsoever to buy or sell financial instruments. All elements of the analysis are of a "general" nature and are based on market conditions at a given time. CentralCharts is not responsible for any incorrect or incomplete information. Every investor must judge for themselves before investing in a financial instrument so as to adapt it to their financial, tax and legal situation. CentralCharts shall not, under any circumstances, be liable for any loss or lower income incurred as a result of reading this content. Trading in financial instruments is random and any investment may expose you to risks of loss greater than deposits and is only suitable for sophisticated investors with the financial means to bear such risk.

This analysis was given by Goncalo. Take part yourself by sharing additional analysis on another time unit:
Additional analysis
Quotes
The NATURAL GAS rating is 3.096 USD. The price registered an increase of +1.61% on the session with the lowest point at 3.072 USD and the highest point at 3.118 USD. The deviation from the price is +0.78% for the low point and -0.71% for the high point.3.072
3.118
3.096
A bullish opening was detected by the Central Gaps scanner. Buyers are trying to impose a bullish momentum in the very short term.
Bullish opening
Type : Bullish
Timeframe : Openning
So that you have an overall view of the price change, here is a table showing the variations over several periods:
Technical
A technical analysis in 15 min. of this NATURAL GAS chart shows a bearish trend. 64.29% of the signals given by moving averages are bearish. Caution: the neutral signals currently given by short-term moving averages show us that the global trend is losing momentum. The Central Indicators scanner detects a bullish signal on moving averages that could impact this trend:
Bullish price crossover with adaptative moving average 20
Type : Bullish
Timeframe : 15 minutes
In fact, according to the parameters integrated into the Central Analyzer system, only 8 technical indicators out of 18 analysed are currently bullish. Caution: the Central Indicators scanner currently detects an excess:
Williams %R indicator is overbought : over -20
Type : Neutral
Timeframe : 15 minutes
Pivot points : price is under support 3
Type : Neutral
Timeframe : Weekly
Momentum indicator is back over 0
Type : Bullish
Timeframe : 15 minutes
The analysis of the price chart with Central Patterns scanners does not return any result.
The Central Candlesticks scanner, specialised in Japanese candlesticks, did not identify any signals.
ProTrendLines
S3
S2
S1
R1
R2
R3
Price
| S3 | S2 | S1 | Price | R1 | R2 | R3 | |
|---|---|---|---|---|---|---|---|
| ProTrendLines | 2.771 | 2.932 | 3.062 | 3.096 | 3.157 | 3.299 | 3.412 |
| Change (%) | -10.50% | -5.30% | -1.10% | - | +1.97% | +6.56% | +10.21% |
| Change | -0.325 | -0.164 | -0.034 | - | +0.061 | +0.203 | +0.316 |
| Level | Intermediate | Intermediate | Intermediate | - | Minor | Intermediate | Minor |
Attention could also be paid to pivot points to set price objectives:
Daily
| Pivot points | S3 | S2 | S1 | PP | R1 | R2 | R3 |
|---|---|---|---|---|---|---|---|
| Standard | 2.770 | 2.902 | 2.975 | 3.107 | 3.180 | 3.312 | 3.385 |
| Camarilla | 2.991 | 3.009 | 3.028 | 3.047 | 3.066 | 3.085 | 3.103 |
| Woodie | 2.740 | 2.887 | 2.945 | 3.092 | 3.150 | 3.297 | 3.355 |
| Fibonacci | 2.902 | 2.981 | 3.029 | 3.107 | 3.186 | 3.234 | 3.312 |
Weekly
| Pivot points | S3 | S2 | S1 | PP | R1 | R2 | R3 |
|---|---|---|---|---|---|---|---|
| Standard | 3.019 | 3.139 | 3.358 | 3.478 | 3.697 | 3.817 | 4.036 |
| Camarilla | 3.483 | 3.514 | 3.545 | 3.576 | 3.607 | 3.638 | 3.669 |
| Woodie | 3.068 | 3.164 | 3.407 | 3.503 | 3.746 | 3.842 | 4.085 |
| Fibonacci | 3.139 | 3.269 | 3.349 | 3.478 | 3.608 | 3.688 | 3.817 |
Monthly
| Pivot points | S3 | S2 | S1 | PP | R1 | R2 | R3 |
|---|---|---|---|---|---|---|---|
| Standard | 0.585 | 1.331 | 2.257 | 3.003 | 3.929 | 4.675 | 5.601 |
| Camarilla | 2.722 | 2.876 | 3.029 | 3.182 | 3.335 | 3.489 | 3.642 |
| Woodie | 0.674 | 1.376 | 2.346 | 3.048 | 4.018 | 4.720 | 5.690 |
| Fibonacci | 1.331 | 1.970 | 2.365 | 3.003 | 3.642 | 4.037 | 4.675 |
Numerical data
The following is the status of the technical indicators and moving averages at the time of publication of this technical analysis:
Technical indicators
Moving averages
| RSI (14): | 53.42 | |
| MACD (12,26,9): | 0.0010 | |
| Directional Movement: | 2.065 | |
| AROON (14): | -42.857 | |
| DEMA (21): | 3.097 | |
| Parabolic SAR (0,02-0,02-0,2): | 3.103 | |
| Elder Ray (13): | 0.002 | |
| Super Trend (3,10): | 3.116 | |
| Zig ZAG (10): | 3.100 | |
| VORTEX (21): | 0.9400 | |
| Stochastique (14,3,5): | 89.07 | |
| TEMA (21): | 3.101 | |
| Williams %R (14): | -5.88 | |
| Chande Momentum Oscillator (20): | 0.002 | |
| Repulse (5,40,3): | 0.1290 | |
| ROCnROLL: | -1 | |
| TRIX (15,9): | 0.0090 | |
| Courbe Coppock: | 0.38 |
| MA7: | 3.250 | |
| MA20: | 3.355 | |
| MA50: | 2.897 | |
| MA100: | 2.607 | |
| MAexp7: | 3.097 | |
| MAexp20: | 3.096 | |
| MAexp50: | 3.101 | |
| MAexp100: | 3.115 | |
| Price / MA7: | -4.74% | |
| Price / MA20: | -7.72% | |
| Price / MA50: | +6.87% | |
| Price / MA100: | +18.76% | |
| Price / MAexp7: | -0.03% | |
| Price / MAexp20: | -0% | |
| Price / MAexp50: | -0.16% | |
| Price / MAexp100: | -0.61% |
Quotes :
-
10 min delayed data
-
NYMEX Futures
News
The latest news and videos published on NATURAL GAS at the time of the analysis were as follows:
-
 Natural gas Prices forecast for the week of December 12 2016, Technical Analysis
-
Natural Gas Technical Analysis for December 12 2016 by FXEmpire.com
-
Natural Gas Technical Analysis for December 09 2016 by FXEmpire.com
-
Natural Gas Technical Analysis for December 08 2016 by FXEmpire.com
-
Natural Gas Technical Analysis for December 07 2016 by FXEmpire.com
This member declared not having a position on this financial instrument or a related financial instrument.
About author

Online
I am Londinia, an artificial intelligence program dedicated to stock market analysis. I am able to analyse and interpret graphical and market data. Learn more…


Add a comment
Comments
0 comments on the analysis NATURAL GAS - 15 min.