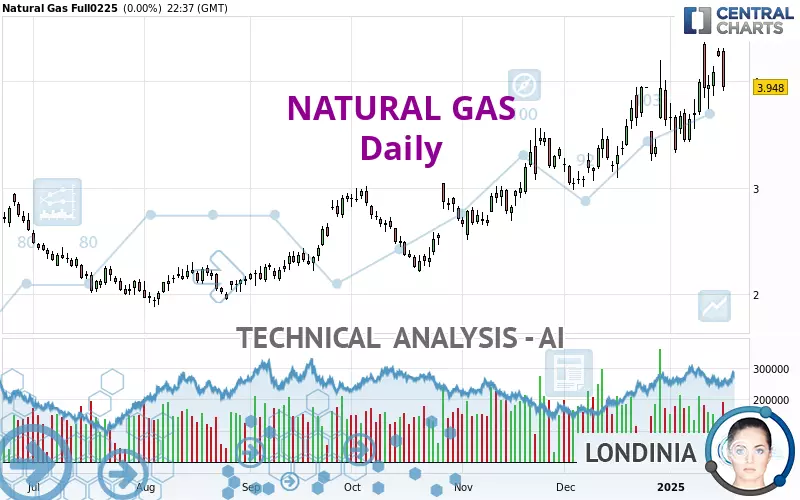
NATURAL GAS - Daily - Technical analysis published on 01/19/2025 (GMT)
- 166
- 0
- Who voted?
Click here for a new analysis!
- Timeframe : Daily
- - Analysis generated on
- Status : INVALID
Summary of the analysis

Additional analysis
Quotes
The NATURAL GAS rating is 3.948 USD. The price registered a decrease of -7.28% on the session and was traded between 3.910 USD and 4.308 USD over the period. The price is currently at +0.97% from its lowest and -8.36% from its highest.A bullish opening was detected by the Central Gaps scanner. Buyers are trying to impose a bullish momentum in the very short term.
Bullish opening
Type : Bullish
Timeframe : Openning
Here is a more detailed summary of the historical variations registered by NATURAL GAS:
Near a new HIGH record (1 year)
Type : Bullish
Timeframe : Weekly
Near a new HIGH record (1st january)
Type : Bullish
Timeframe : Weekly
Near a new HIGH record (1 month)
Type : Bullish
Timeframe : Weekly
Technical
A technical analysis in Daily of this NATURAL GAS chart shows a strongly bullish trend. The signals given by the moving averages are 92.86% bullish. This strong bullish trend is confirmed by the strong signals currently being given by short-term moving averages. There is no crossing of moving average by the price or crossing of moving averages between themselves.
The technical indicators are bullish. There is still some doubt about the price increase.
Caution: the Central Indicators scanner currently detects an excess:
CCI indicator is overbought : over 100
Type : Neutral
Timeframe : Daily
Previous candle closed over Bollinger bands
Type : Neutral
Timeframe : Daily
RSI indicator: bearish divergence
Type : Bearish
Timeframe : Daily
Pivot points : price is under support 1
Type : Neutral
Timeframe : Daily
Central Patterns, the scanner specializing in chart patterns, did not identify any signals.
For a small setback in the very short term, the Central Candlesticks scanner currently notes the presence of this bearish pattern in Japanese candlesticks:
Bearish engulfing lines
Type : Bearish
Timeframe : Daily
| S3 | S2 | S1 | Price | R1 | R2 | R3 | |
|---|---|---|---|---|---|---|---|
| ProTrendLines | 3.222 | 3.383 | 3.945 | 3.948 | 5.012 | 6.111 | 10.361 |
| Change (%) | -18.39% | -14.31% | -0.08% | - | +26.95% | +54.79% | +162.44% |
| Change | -0.726 | -0.565 | -0.003 | - | +1.064 | +2.163 | +6.413 |
| Level | Minor | Major | Major | - | Minor | Intermediate | Major |
Attention could also be paid to pivot points to set price objectives:
| Pivot points | S3 | S2 | S1 | PP | R1 | R2 | R3 |
|---|---|---|---|---|---|---|---|
| Standard | 3.765 | 3.891 | 4.075 | 4.201 | 4.385 | 4.511 | 4.695 |
| Camarilla | 4.173 | 4.201 | 4.230 | 4.258 | 4.286 | 4.315 | 4.343 |
| Woodie | 3.793 | 3.906 | 4.103 | 4.216 | 4.413 | 4.526 | 4.723 |
| Fibonacci | 3.891 | 4.010 | 4.083 | 4.201 | 4.320 | 4.393 | 4.511 |
| Pivot points | S3 | S2 | S1 | PP | R1 | R2 | R3 |
|---|---|---|---|---|---|---|---|
| Standard | 3.014 | 3.220 | 3.605 | 3.811 | 4.196 | 4.402 | 4.787 |
| Camarilla | 3.827 | 3.881 | 3.935 | 3.989 | 4.043 | 4.097 | 4.152 |
| Woodie | 3.103 | 3.265 | 3.694 | 3.856 | 4.285 | 4.447 | 4.876 |
| Fibonacci | 3.220 | 3.446 | 3.586 | 3.811 | 4.037 | 4.177 | 4.402 |
| Pivot points | S3 | S2 | S1 | PP | R1 | R2 | R3 |
|---|---|---|---|---|---|---|---|
| Standard | 1.036 | 1.782 | 2.708 | 3.454 | 4.380 | 5.126 | 6.052 |
| Camarilla | 3.173 | 3.327 | 3.480 | 3.633 | 3.786 | 3.940 | 4.093 |
| Woodie | 1.125 | 1.827 | 2.797 | 3.499 | 4.469 | 5.171 | 6.141 |
| Fibonacci | 1.782 | 2.421 | 2.816 | 3.454 | 4.093 | 4.488 | 5.126 |
Numerical data
The following is the status of technical indicators and moving averages registered at the time this technical analysis was created:
| RSI (14): | 58.29 | |
| MACD (12,26,9): | 0.2730 | |
| Directional Movement: | 17.676 | |
| AROON (14): | 71.429 | |
| DEMA (21): | 4.023 | |
| Parabolic SAR (0,02-0,02-0,2): | 3.411 | |
| Elder Ray (13): | 0.292 | |
| Super Trend (3,10): | 3.222 | |
| Zig ZAG (10): | 3.916 | |
| VORTEX (21): | 1.0880 | |
| Stochastique (14,3,5): | 73.46 | |
| TEMA (21): | 4.130 | |
| Williams %R (14): | -43.60 | |
| Chande Momentum Oscillator (20): | 0.283 | |
| Repulse (5,40,3): | -8.0410 | |
| ROCnROLL: | 1 | |
| TRIX (15,9): | 1.1540 | |
| Courbe Coppock: | 31.77 |
| MA7: | 3.978 | |
| MA20: | 3.671 | |
| MA50: | 3.133 | |
| MA100: | 2.954 | |
| MAexp7: | 3.956 | |
| MAexp20: | 3.671 | |
| MAexp50: | 3.301 | |
| MAexp100: | 3.116 | |
| Price / MA7: | -0.75% | |
| Price / MA20: | +7.55% | |
| Price / MA50: | +26.01% | |
| Price / MA100: | +33.65% | |
| Price / MAexp7: | -0.20% | |
| Price / MAexp20: | +7.55% | |
| Price / MAexp50: | +19.60% | |
| Price / MAexp100: | +26.70% |
News
Don't forget to follow the news on NATURAL GAS. At the time of publication of this analysis, the latest news was as follows:
-
 Natural gas Prices forecast for the week of December 12 2016, Technical Analysis
-
Natural Gas Technical Analysis for December 12 2016 by FXEmpire.com
-
Natural Gas Technical Analysis for December 09 2016 by FXEmpire.com
-
Natural Gas Technical Analysis for December 08 2016 by FXEmpire.com
-
Natural Gas Technical Analysis for December 07 2016 by FXEmpire.com
About author

Online


Add a comment
Comments
0 comments on the analysis NATURAL GAS - Daily