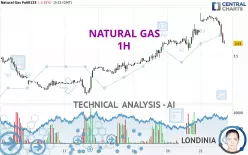
NATURAL GAS - 1H - Technical analysis published on 12/23/2024 (GMT)
- 108
- 0
- Who voted?
Click here for a new analysis!
- Timeframe : 1H
- - Analysis generated on
- Status : INVALID

Summary of the analysis

Additional analysis
Quotes
NATURAL GAS rating 3.630 USD. The price registered a decrease of -3.15% on the session and was between 3.628 USD and 3.944 USD. This implies that the price is at +0.06% from its lowest and at -7.96% from its highest.The Central Gaps scanner detects the formation of a bullish gap marking the strong presence of buyers against sellers at the opening. This formed a quotation gap.
Opening Gap UP
Type : Bullish
Timeframe : Openning
A study of price movements over other periods shows the following variations:
New HIGH record (1 month)
Type : Bullish
Timeframe : Weekly
Technical
Technical analysis of this 1H chart of NATURAL GAS indicates that the overall trend is slightly bullish. 57.14% of the signals given by moving averages are bullish. Caution: the strong bearish signals currently given by short-term moving averages indicate that a trend reversal may be taking place. The Central Indicators scanner detects a bearish signal on moving averages that could impact this trend:
Bearish trend reversal : adaptative moving average 50
Type : Bearish
Timeframe : 1 hour
On the 18 technical indicators analysed, 4 are bullish, 4 are neutral and 10 are bearish. Caution: the Central Indicators scanner currently detects an excess:
CCI indicator is oversold : under -100
Type : Neutral
Timeframe : 1 hour
Williams %R indicator is oversold : under -80
Type : Neutral
Timeframe : 1 hour
No signals are given by Central Patterns, a market scanner specialised in chart patterns, resistances and supports.
For a small setback in the very short term, the Central Candlesticks scanner currently notes the presence of this bearish pattern in Japanese candlesticks:
Three black crows
Type : Bearish
Timeframe : 1 hour
| S3 | S2 | S1 | Price | R1 | R2 | R3 | |
|---|---|---|---|---|---|---|---|
| ProTrendLines | 3.145 | 3.479 | 3.556 | 3.630 | 3.669 | 4.186 | 4.399 |
| Change (%) | -13.36% | -4.16% | -2.04% | - | +1.07% | +15.32% | +21.18% |
| Change | -0.485 | -0.151 | -0.074 | - | +0.039 | +0.556 | +0.769 |
| Level | Minor | Intermediate | Major | - | Major | Minor | Major |
To determine price objectives, it is also possible to use the pivot points. Here is the price position in relation to pivot points:
| Pivot points | S3 | S2 | S1 | PP | R1 | R2 | R3 |
|---|---|---|---|---|---|---|---|
| Standard | 3.318 | 3.436 | 3.592 | 3.710 | 3.866 | 3.984 | 4.140 |
| Camarilla | 3.673 | 3.698 | 3.723 | 3.748 | 3.773 | 3.798 | 3.823 |
| Woodie | 3.337 | 3.446 | 3.611 | 3.720 | 3.885 | 3.994 | 4.159 |
| Fibonacci | 3.436 | 3.541 | 3.605 | 3.710 | 3.815 | 3.879 | 3.984 |
| Pivot points | S3 | S2 | S1 | PP | R1 | R2 | R3 |
|---|---|---|---|---|---|---|---|
| Standard | 2.546 | 2.819 | 3.283 | 3.556 | 4.020 | 4.293 | 4.757 |
| Camarilla | 3.545 | 3.613 | 3.680 | 3.748 | 3.816 | 3.883 | 3.951 |
| Woodie | 2.643 | 2.867 | 3.380 | 3.604 | 4.117 | 4.341 | 4.854 |
| Fibonacci | 2.819 | 3.100 | 3.274 | 3.556 | 3.837 | 4.011 | 4.293 |
| Pivot points | S3 | S2 | S1 | PP | R1 | R2 | R3 |
|---|---|---|---|---|---|---|---|
| Standard | 1.736 | 2.208 | 2.785 | 3.257 | 3.834 | 4.306 | 4.883 |
| Camarilla | 3.075 | 3.171 | 3.267 | 3.363 | 3.459 | 3.555 | 3.652 |
| Woodie | 1.790 | 2.234 | 2.839 | 3.283 | 3.888 | 4.332 | 4.937 |
| Fibonacci | 2.208 | 2.608 | 2.856 | 3.257 | 3.657 | 3.905 | 4.306 |
Numerical data
The following are the details of the technical indicators and moving averages that were collected to generate this technical analysis:
| RSI (14): | 33.29 | |
| MACD (12,26,9): | 0.0080 | |
| Directional Movement: | -15.700 | |
| AROON (14): | -64.286 | |
| DEMA (21): | 3.814 | |
| Parabolic SAR (0,02-0,02-0,2): | 3.927 | |
| Elder Ray (13): | -0.135 | |
| Super Trend (3,10): | 3.809 | |
| Zig ZAG (10): | 3.654 | |
| VORTEX (21): | 0.8740 | |
| Stochastique (14,3,5): | 6.74 | |
| TEMA (21): | 3.766 | |
| Williams %R (14): | -94.48 | |
| Chande Momentum Oscillator (20): | -0.228 | |
| Repulse (5,40,3): | -3.9620 | |
| ROCnROLL: | 2 | |
| TRIX (15,9): | 0.1880 | |
| Courbe Coppock: | 3.14 |
| MA7: | 3.452 | |
| MA20: | 3.305 | |
| MA50: | 3.164 | |
| MA100: | 3.228 | |
| MAexp7: | 3.748 | |
| MAexp20: | 3.797 | |
| MAexp50: | 3.703 | |
| MAexp100: | 3.580 | |
| Price / MA7: | +5.16% | |
| Price / MA20: | +9.83% | |
| Price / MA50: | +14.73% | |
| Price / MA100: | +12.45% | |
| Price / MAexp7: | -3.15% | |
| Price / MAexp20: | -4.40% | |
| Price / MAexp50: | -1.97% | |
| Price / MAexp100: | +1.40% |
News
The last news published on NATURAL GAS at the time of the generation of this analysis was as follows:
-
 Natural gas Prices forecast for the week of December 12 2016, Technical Analysis
-
Natural Gas Technical Analysis for December 12 2016 by FXEmpire.com
-
Natural Gas Technical Analysis for December 09 2016 by FXEmpire.com
-
Natural Gas Technical Analysis for December 08 2016 by FXEmpire.com
-
Natural Gas Technical Analysis for December 07 2016 by FXEmpire.com
About author

Online


Add a comment
Comments
0 comments on the analysis NATURAL GAS - 1H