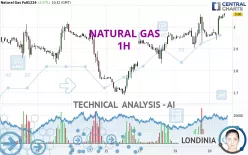
NATURAL GAS - 1H - Technical analysis published on 11/20/2024 (GMT)
- 91
- 0
Click here for a new analysis!
- Timeframe : 1H
- - Analysis generated on
- Status : TARGET REACHED

Summary of the analysis

Additional analysis
Quotes
The NATURAL GAS price is 3.060 USD. The price has increased by +2.07% since the last closing and was traded between 2.942 USD and 3.063 USD over the period. The price is currently at +4.01% from its lowest and -0.10% from its highest.The Central Gaps scanner detects a bearish opening marking the presence of sellers ahead of buyers at the opening but not sufficiently marked to allow the price to register a quotation gap.
Bearish opening
Type : Bearish
Timeframe : Openning
Here is a more detailed summary of the historical variations registered by NATURAL GAS:
Near a new HIGH record (1 month)
Type : Bullish
Timeframe : Weekly
Technical
A technical analysis in 1H of this NATURAL GAS chart shows a strongly bullish trend. The signals given by the moving averages are 92.86% bullish. This strong bullish trend is confirmed by the strong signals currently being given by short-term moving averages. The Central Indicators market scanner currently does not detect any result that concerns moving averages.
In fact, according to the parameters integrated into the Central Analyzer system, 14 technical indicators out of 18 analysed are currently bullish. But beware of excesses. The Central Indicators scanner currently detects this:
CCI indicator is overbought : over 100
Type : Neutral
Timeframe : 1 hour
Williams %R indicator is overbought : over -20
Type : Neutral
Timeframe : 1 hour
Pivot points : price is over resistance 1
Type : Neutral
Timeframe : Weekly
No signals are given by Central Patterns, a market scanner specialised in chart patterns, resistances and supports.
There is also a Japanese candlestick pattern detected by Central Candlesticks that could mark the end of the current short-term trend:
Doji
Type : Neutral
Timeframe : 1 hour
| S3 | S2 | S1 | Price | R1 | R2 | R3 | |
|---|---|---|---|---|---|---|---|
| ProTrendLines | 2.975 | 3.020 | 3.058 | 3.060 | 3.095 | 3.504 | 3.666 |
| Change (%) | -2.78% | -1.31% | -0.07% | - | +1.14% | +14.51% | +19.80% |
| Change | -0.085 | -0.040 | -0.002 | - | +0.035 | +0.444 | +0.606 |
| Level | Intermediate | Minor | Minor | - | Minor | Intermediate | Minor |
To determine price objectives, it is also possible to use the pivot points. Here is the price position in relation to pivot points:
| Pivot points | S3 | S2 | S1 | PP | R1 | R2 | R3 |
|---|---|---|---|---|---|---|---|
| Standard | 2.763 | 2.834 | 2.916 | 2.987 | 3.069 | 3.140 | 3.222 |
| Camarilla | 2.956 | 2.970 | 2.984 | 2.998 | 3.012 | 3.026 | 3.040 |
| Woodie | 2.769 | 2.837 | 2.922 | 2.990 | 3.075 | 3.143 | 3.228 |
| Fibonacci | 2.834 | 2.892 | 2.929 | 2.987 | 3.045 | 3.082 | 3.140 |
| Pivot points | S3 | S2 | S1 | PP | R1 | R2 | R3 |
|---|---|---|---|---|---|---|---|
| Standard | 2.335 | 2.512 | 2.667 | 2.844 | 2.999 | 3.176 | 3.331 |
| Camarilla | 2.732 | 2.762 | 2.793 | 2.823 | 2.853 | 2.884 | 2.914 |
| Woodie | 2.325 | 2.507 | 2.657 | 2.839 | 2.989 | 3.171 | 3.321 |
| Fibonacci | 2.512 | 2.639 | 2.717 | 2.844 | 2.971 | 3.049 | 3.176 |
| Pivot points | S3 | S2 | S1 | PP | R1 | R2 | R3 |
|---|---|---|---|---|---|---|---|
| Standard | 1.423 | 2.028 | 2.345 | 2.950 | 3.267 | 3.872 | 4.189 |
| Camarilla | 2.410 | 2.494 | 2.579 | 2.663 | 2.748 | 2.832 | 2.917 |
| Woodie | 1.280 | 1.956 | 2.202 | 2.878 | 3.124 | 3.800 | 4.046 |
| Fibonacci | 2.028 | 2.380 | 2.598 | 2.950 | 3.302 | 3.520 | 3.872 |
Numerical data
The following is the status of technical indicators and moving averages registered at the time this technical analysis was created:
| RSI (14): | 67.43 | |
| MACD (12,26,9): | 0.0240 | |
| Directional Movement: | 11.640 | |
| AROON (14): | 28.571 | |
| DEMA (21): | 3.028 | |
| Parabolic SAR (0,02-0,02-0,2): | 2.944 | |
| Elder Ray (13): | 0.039 | |
| Super Trend (3,10): | 2.972 | |
| Zig ZAG (10): | 3.056 | |
| VORTEX (21): | 1.1820 | |
| Stochastique (14,3,5): | 94.41 | |
| TEMA (21): | 3.035 | |
| Williams %R (14): | -3.48 | |
| Chande Momentum Oscillator (20): | 0.099 | |
| Repulse (5,40,3): | 1.0390 | |
| ROCnROLL: | 1 | |
| TRIX (15,9): | 0.0790 | |
| Courbe Coppock: | 2.96 |
| MA7: | 2.933 | |
| MA20: | 2.855 | |
| MA50: | 3.044 | |
| MA100: | 3.055 | |
| MAexp7: | 3.031 | |
| MAexp20: | 2.998 | |
| MAexp50: | 2.961 | |
| MAexp100: | 2.924 | |
| Price / MA7: | +4.33% | |
| Price / MA20: | +7.18% | |
| Price / MA50: | +0.53% | |
| Price / MA100: | +0.16% | |
| Price / MAexp7: | +0.96% | |
| Price / MAexp20: | +2.07% | |
| Price / MAexp50: | +3.34% | |
| Price / MAexp100: | +4.65% |
News
The last news published on NATURAL GAS at the time of the generation of this analysis was as follows:
-
 Natural gas Prices forecast for the week of December 12 2016, Technical Analysis
-
Natural Gas Technical Analysis for December 12 2016 by FXEmpire.com
-
Natural Gas Technical Analysis for December 09 2016 by FXEmpire.com
-
Natural Gas Technical Analysis for December 08 2016 by FXEmpire.com
-
Natural Gas Technical Analysis for December 07 2016 by FXEmpire.com
About author

Online


Add a comment
Comments
0 comments on the analysis NATURAL GAS - 1H