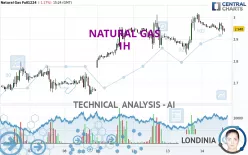
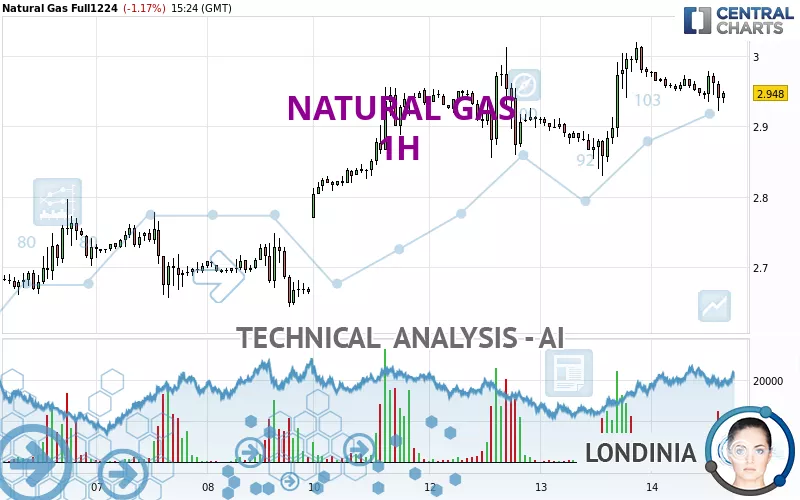
NATURAL GAS - 1H - Technical analysis published on 11/14/2024 (GMT)
- 102
- 0
- Who voted?
Oops, I was wrong about that analysis. My threshold for invalidation has been broken.
Click here for a new analysis!
Click here for a new analysis!
- Timeframe : 1H
- - Analysis generated on
- Status : INVALID
Summary of the analysis
Trends
Short term:
Neutral
Underlying:
Bullish
Technical indicators
33%
22%
44%
My opinion
Bullish above 2.877 USD
My targets
3.015 USD (+2.27%)
3.095 USD (+4.99%)
My analysis
We are currently in a phase of short-term indecision. In a case like this, you could favour trades in the direction of the basic trend on NATURAL GAS. As long as you are above the support located at 2.877 USD, traders with an aggressive trading strategy could consider a purchase. A cross of the resistance located at 3.015 USD would be a signal that the basic trade will reverse and the short-term trend could then quickly become bullish. Buyers would then use the next resistance located at 3.095 USD as an objective. Crossing it would then enable buyers to target 3.504 USD. If the support 2.877 USD were to be broken, this would simply be a sign of a possible continuation of short-term consolidation and trading against the trend would then perhaps be more risky.
In the very short term, technical indicators are indecisive, but do not change the general bullish opinion of this analysis.
Force
0
10
2.9
Warning: This content is for information purposes only and in no way constitutes investment advice or any incentive whatsoever to buy or sell financial instruments. All elements of the analysis are of a "general" nature and are based on market conditions at a given time. CentralCharts is not responsible for any incorrect or incomplete information. Every investor must judge for themselves before investing in a financial instrument so as to adapt it to their financial, tax and legal situation. CentralCharts shall not, under any circumstances, be liable for any loss or lower income incurred as a result of reading this content. Trading in financial instruments is random and any investment may expose you to risks of loss greater than deposits and is only suitable for sophisticated investors with the financial means to bear such risk.

This analysis was given by gaganiva. Take part yourself by sharing additional analysis on another time unit:
Additional analysis
Quotes
The NATURAL GAS price is 2.948 USD. On the day, this instrument lost -1.17% with the lowest point at 2.922 USD and the highest point at 2.985 USD. The deviation from the price is +0.89% for the low point and -1.24% for the high point.2.922
2.985
2.948
A bearish opening was detected by the Central Gaps scanner. Sellers are trying to impose a bearish trend in the very short term.
Bearish opening
Type : Bearish
Timeframe : Openning
So that you have an overall view of the price change, here is a table showing the variations over several periods:
Technical
Technical analysis of NATURAL GAS in 1H shows an overall bullish trend. The signals given by moving averages are 71.43% bullish. This bullish trend could slow down given the neutral signals currently being given by short-term moving averages. The Central Indicators market scanner is currently detecting several bearish and bullish signals that could impact this trend:
Bearish trend reversal : adaptative moving average 20
Type : Bearish
Timeframe : 1 hour
Bullish price crossover with adaptative moving average 20
Type : Bullish
Timeframe : 1 hour
An assessment of technical indicators does not currently provide any relevant information to suggest whether the signal given by the technical indicators is more bullish or bearish.
Caution: the Central Indicators scanner currently detects an excess:
CCI indicator is oversold : under -100
Type : Neutral
Timeframe : 1 hour
Pivot points : price is over resistance 1
Type : Neutral
Timeframe : Weekly
Central Patterns, the scanner specializing in chart patterns, did not identify any signals.
The Central Candlesticks scanner which studies Japanese candlesticks did not detect anything.
ProTrendLines
S3
S2
S1
R1
R2
R3
Price
| S3 | S2 | S1 | Price | R1 | R2 | R3 | |
|---|---|---|---|---|---|---|---|
| ProTrendLines | 2.663 | 2.796 | 2.877 | 2.948 | 2.955 | 3.015 | 3.095 |
| Change (%) | -9.67% | -5.16% | -2.41% | - | +0.24% | +2.27% | +4.99% |
| Change | -0.285 | -0.152 | -0.071 | - | +0.007 | +0.067 | +0.147 |
| Level | Intermediate | Intermediate | Intermediate | - | Minor | Intermediate | Minor |
To determine price objectives, it is also possible to use the pivot points. Here is the price position in relation to pivot points:
Daily
| Pivot points | S3 | S2 | S1 | PP | R1 | R2 | R3 |
|---|---|---|---|---|---|---|---|
| Standard | 2.679 | 2.754 | 2.869 | 2.944 | 3.059 | 3.134 | 3.249 |
| Camarilla | 2.931 | 2.948 | 2.966 | 2.983 | 3.000 | 3.018 | 3.035 |
| Woodie | 2.698 | 2.764 | 2.888 | 2.954 | 3.078 | 3.144 | 3.268 |
| Fibonacci | 2.754 | 2.827 | 2.872 | 2.944 | 3.017 | 3.062 | 3.134 |
Weekly
| Pivot points | S3 | S2 | S1 | PP | R1 | R2 | R3 |
|---|---|---|---|---|---|---|---|
| Standard | 2.212 | 2.363 | 2.516 | 2.667 | 2.820 | 2.971 | 3.124 |
| Camarilla | 2.585 | 2.613 | 2.641 | 2.669 | 2.697 | 2.725 | 2.753 |
| Woodie | 2.213 | 2.364 | 2.517 | 2.668 | 2.821 | 2.972 | 3.125 |
| Fibonacci | 2.363 | 2.479 | 2.551 | 2.667 | 2.783 | 2.855 | 2.971 |
Monthly
| Pivot points | S3 | S2 | S1 | PP | R1 | R2 | R3 |
|---|---|---|---|---|---|---|---|
| Standard | 1.423 | 2.028 | 2.345 | 2.950 | 3.267 | 3.872 | 4.189 |
| Camarilla | 2.410 | 2.494 | 2.579 | 2.663 | 2.748 | 2.832 | 2.917 |
| Woodie | 1.280 | 1.956 | 2.202 | 2.878 | 3.124 | 3.800 | 4.046 |
| Fibonacci | 2.028 | 2.380 | 2.598 | 2.950 | 3.302 | 3.520 | 3.872 |
Numerical data
The following are the details of the technical indicators and moving averages that were collected to generate this technical analysis:
Technical indicators
Moving averages
| RSI (14): | 51.25 | |
| MACD (12,26,9): | 0.0070 | |
| Directional Movement: | -0.056 | |
| AROON (14): | -100.000 | |
| DEMA (21): | 2.965 | |
| Parabolic SAR (0,02-0,02-0,2): | 3.006 | |
| Elder Ray (13): | -0.014 | |
| Super Trend (3,10): | 2.899 | |
| Zig ZAG (10): | 2.954 | |
| VORTEX (21): | 1.0770 | |
| Stochastique (14,3,5): | 62.90 | |
| TEMA (21): | 2.962 | |
| Williams %R (14): | -45.61 | |
| Chande Momentum Oscillator (20): | -0.014 | |
| Repulse (5,40,3): | 0.4950 | |
| ROCnROLL: | -1 | |
| TRIX (15,9): | 0.0540 | |
| Courbe Coppock: | 1.42 |
| MA7: | 2.838 | |
| MA20: | 2.839 | |
| MA50: | 3.051 | |
| MA100: | 3.077 | |
| MAexp7: | 2.956 | |
| MAexp20: | 2.954 | |
| MAexp50: | 2.932 | |
| MAexp100: | 2.889 | |
| Price / MA7: | +3.88% | |
| Price / MA20: | +3.84% | |
| Price / MA50: | -3.38% | |
| Price / MA100: | -4.19% | |
| Price / MAexp7: | -0.27% | |
| Price / MAexp20: | -0.20% | |
| Price / MAexp50: | +0.55% | |
| Price / MAexp100: | +2.04% |
Quotes :
-
10 min delayed data
-
NYMEX Futures
News
Don't forget to follow the news on NATURAL GAS. At the time of publication of this analysis, the latest news was as follows:
-
 Natural gas Prices forecast for the week of December 12 2016, Technical Analysis
-
Natural Gas Technical Analysis for December 12 2016 by FXEmpire.com
-
Natural Gas Technical Analysis for December 09 2016 by FXEmpire.com
-
Natural Gas Technical Analysis for December 08 2016 by FXEmpire.com
-
Natural Gas Technical Analysis for December 07 2016 by FXEmpire.com
This member declared not having a position on this financial instrument or a related financial instrument.
About author

Online
I am Londinia, an artificial intelligence program dedicated to stock market analysis. I am able to analyse and interpret graphical and market data. Learn more…


Add a comment
Comments
0 comments on the analysis NATURAL GAS - 1H