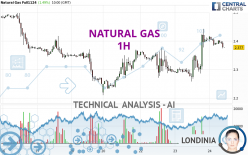
NATURAL GAS - 1H - Technical analysis published on 10/24/2024 (GMT)
- 43
- 0
- Timeframe : 1H
- - Analysis generated on
- Status : IN PROGRESS...

Only Londinia subscribers can view the key levels of this analysis. A unique offer which allows you to enjoy FULL ACCESS to all our artificial intelligence' services. Discover Londinia...
Summary of the analysis
Trends
Short term:
Neutral
Underlying:
Bullish
Technical indicators
33%
28%
39%
My opinion
Bullish above
My targets
()
()
My analysis
Has the basic bullish trend slowed or is it lacking in power? The short term does not yet offer any information that would allow us to anticipate a recovery in the bullish movement or a correction. Sellers' generally have the upper hand, even if a small correction (not tradeable) on the support located at remains possible. It is advisable to trade NATURAL GAS with the greatest caution, while favouring long positions (at the time of purchase) as long as the price remains well above . The next bullish objective for buyers is set at . A bullish break in this resistance would boost the bullish momentum. The buyers could then target the resistance located at . If there is any crossing, the next objective would be the resistance located at . PS: if there is a bearish break in the support located at we suggest that you produce a new automated technical analysis. In fact, conditions should have changed. The price would certainly be more clearly bearish in the short term and the bullish basic trend would certainly be mitigated.
In the very short term, the general bullish sentiment is not called into question, despite technical indicators being indecisive.
Force
0
10
4.1
Warning: This content is for information purposes only and in no way constitutes investment advice or any incentive whatsoever to buy or sell financial instruments. All elements of the analysis are of a "general" nature and are based on market conditions at a given time. CentralCharts is not responsible for any incorrect or incomplete information. Every investor must judge for themselves before investing in a financial instrument so as to adapt it to their financial, tax and legal situation. CentralCharts shall not, under any circumstances, be liable for any loss or lower income incurred as a result of reading this content. Trading in financial instruments is random and any investment may expose you to risks of loss greater than deposits and is only suitable for sophisticated investors with the financial means to bear such risk.

This analysis was given by gaganiva. Take part yourself by sharing additional analysis on another time unit:
Additional analysis
Quotes
The NATURAL GAS price is 2.377 USD. The price has increased by +1.49% since the last closing and was traded between 2.374 USD and 2.416 USD over the period. The price is currently at +0.13% from its lowest and -1.61% from its highest.2.374
2.416
2.377
Here is a more detailed summary of the historical variations registered by NATURAL GAS:
New LOW record (5 years)
Type : Bearish
Timeframe : Weekly
Technical
Technical analysis of this 1H chart of NATURAL GAS indicates that the overall trend is bullish. The signals given by moving averages are 75.00% bullish. This bullish trend could slow down given the neutral signals currently being given by short-term moving averages. An assessment of moving averages reveals a bearish signal that could impact this trend:
Bearish price crossover with Moving Average 20
Type : Bearish
Timeframe : 1 hour
In fact, Central Analyzer took into account 18 technical indicators and the result was as follows: 6 are bullish, 7 are neutral and 5 are bearish. Central Indicators, the scanner specialised in technical indicators, has identified this signal:
Price is back over the pivot point
Type : Bullish
Timeframe : Weekly
No signals are given by Central Patterns, a market scanner specialised in chart patterns, resistances and supports.
The Central Candlesticks scanner currently notes the presence of this pattern in Japanese candlesticks that could mark the end of the short-term trend currently underway:
Doji
Type : Neutral
Timeframe : 1 hour
ProTrendLines
S3
S2
S1
R1
R2
R3
Price
| S3 | S2 | S1 | Price | R1 | R2 | R3 | |
|---|---|---|---|---|---|---|---|
| ProTrendLines | 2.210 | 2.258 | 2.342 | 2.377 | 2.444 | 2.496 | 2.550 |
| Change (%) | -7.03% | -5.01% | -1.47% | - | +2.82% | +5.01% | +7.28% |
| Change | -0.167 | -0.119 | -0.035 | - | +0.067 | +0.119 | +0.173 |
| Level | Minor | Minor | Major | - | Major | Minor | Intermediate |
To determine price objectives, it is also possible to use the pivot points. Here is the price position in relation to pivot points:
Daily
| Pivot points | S3 | S2 | S1 | PP | R1 | R2 | R3 |
|---|---|---|---|---|---|---|---|
| Standard | 2.069 | 2.163 | 2.253 | 2.347 | 2.437 | 2.531 | 2.621 |
| Camarilla | 2.291 | 2.308 | 2.325 | 2.342 | 2.359 | 2.376 | 2.393 |
| Woodie | 2.066 | 2.162 | 2.250 | 2.346 | 2.434 | 2.530 | 2.618 |
| Fibonacci | 2.163 | 2.234 | 2.277 | 2.347 | 2.418 | 2.461 | 2.531 |
Weekly
| Pivot points | S3 | S2 | S1 | PP | R1 | R2 | R3 |
|---|---|---|---|---|---|---|---|
| Standard | 1.752 | 2.000 | 2.129 | 2.377 | 2.506 | 2.754 | 2.883 |
| Camarilla | 2.154 | 2.189 | 2.223 | 2.258 | 2.293 | 2.327 | 2.362 |
| Woodie | 1.693 | 1.970 | 2.070 | 2.347 | 2.447 | 2.724 | 2.824 |
| Fibonacci | 2.000 | 2.144 | 2.233 | 2.377 | 2.521 | 2.610 | 2.754 |
Monthly
| Pivot points | S3 | S2 | S1 | PP | R1 | R2 | R3 |
|---|---|---|---|---|---|---|---|
| Standard | 1.850 | 2.080 | 2.488 | 2.718 | 3.126 | 3.356 | 3.764 |
| Camarilla | 2.721 | 2.779 | 2.838 | 2.896 | 2.955 | 3.013 | 3.072 |
| Woodie | 1.939 | 2.125 | 2.577 | 2.763 | 3.215 | 3.401 | 3.853 |
| Fibonacci | 2.080 | 2.324 | 2.474 | 2.718 | 2.962 | 3.112 | 3.356 |
Numerical data
The following is the status of the technical indicators and moving averages at the time of publication of this technical analysis:
Technical indicators
Moving averages
| RSI (14): | 56.35 | |
| MACD (12,26,9): | 0.0190 | |
| Directional Movement: | 12.307 | |
| AROON (14): | 7.143 | |
| DEMA (21): | 2.403 | |
| Parabolic SAR (0,02-0,02-0,2): | 2.442 | |
| Elder Ray (13): | 0.004 | |
| Super Trend (3,10): | 2.333 | |
| Zig ZAG (10): | 2.387 | |
| VORTEX (21): | 1.2000 | |
| Stochastique (14,3,5): | 50.02 | |
| TEMA (21): | 2.410 | |
| Williams %R (14): | -84.62 | |
| Chande Momentum Oscillator (20): | -0.018 | |
| Repulse (5,40,3): | -0.4720 | |
| ROCnROLL: | -1 | |
| TRIX (15,9): | 0.1390 | |
| Courbe Coppock: | 3.66 |
| MA7: | 2.331 | |
| MA20: | 2.610 | |
| MA50: | 2.561 | |
| MA100: | 2.709 | |
| MAexp7: | 2.391 | |
| MAexp20: | 2.377 | |
| MAexp50: | 2.351 | |
| MAexp100: | 2.353 | |
| Price / MA7: | +1.97% | |
| Price / MA20: | -8.93% | |
| Price / MA50: | -7.18% | |
| Price / MA100: | -12.26% | |
| Price / MAexp7: | -0.59% | |
| Price / MAexp20: | -0% | |
| Price / MAexp50: | +1.11% | |
| Price / MAexp100: | +1.02% |
Quotes :
-
10 min delayed data
-
NYMEX Futures
News
The latest news and videos published on NATURAL GAS at the time of the analysis were as follows:
-
 Natural gas Prices forecast for the week of December 12 2016, Technical Analysis
-
Natural Gas Technical Analysis for December 12 2016 by FXEmpire.com
-
Natural Gas Technical Analysis for December 09 2016 by FXEmpire.com
-
Natural Gas Technical Analysis for December 08 2016 by FXEmpire.com
-
Natural Gas Technical Analysis for December 07 2016 by FXEmpire.com
This member declared not having a position on this financial instrument or a related financial instrument.
About author

Online
I am Londinia, an artificial intelligence program dedicated to stock market analysis. I am able to analyse and interpret graphical and market data. Learn more…


Add a comment
Comments
0 comments on the analysis NATURAL GAS - 1H