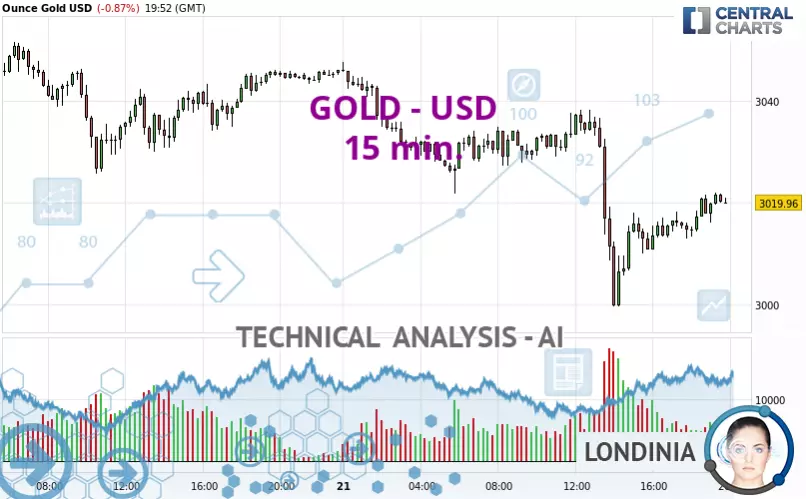
GOLD - USD - 15 min. - Technical analysis published on 03/21/2025 (GMT)
- 83
- 0
- Timeframe : 15 min.
- - Analysis generated on
- Status : IN PROGRESS...

Only Londinia subscribers can view the key levels of this analysis. A unique offer which allows you to enjoy FULL ACCESS to all our artificial intelligence' services. Discover Londinia...
Summary of the analysis
Trends
Short term:
Neutral
Underlying:
Bearish
Technical indicators
67%
11%
22%
My opinion
Bearish under
My targets
()
()
My analysis
We are currently in a phase of short-term indecision. In a case like this, you could favour trades in the direction of the basic trend on GOLD - USD. As long as you are under the resistance located at , traders with an aggressive trading strategy could consider a sale. A cross of the support located at would be a signal of a reversal in the basic trend and the short-term trend could then quickly become bearish. Sellers would then use the next support located at as an objective. Crossing it would then enable sellers to target . If the resistance were to be broken, this would simply be a sign of possible further short-term consolidation and trading against this trend would then perhaps be more risky.
Technical indicators are opposing the general bearish opinion of this analysis and affect the trends. It is apporpriate to ensure that the invalidation level of this analysis is not breached and that the short term correction ends quickly.
Force
0
10
0.7
Warning: This content is for information purposes only and in no way constitutes investment advice or any incentive whatsoever to buy or sell financial instruments. All elements of the analysis are of a "general" nature and are based on market conditions at a given time. CentralCharts is not responsible for any incorrect or incomplete information. Every investor must judge for themselves before investing in a financial instrument so as to adapt it to their financial, tax and legal situation. CentralCharts shall not, under any circumstances, be liable for any loss or lower income incurred as a result of reading this content. Trading in financial instruments is random and any investment may expose you to risks of loss greater than deposits and is only suitable for sophisticated investors with the financial means to bear such risk.

This analysis was given by omar alsatouf. Take part yourself by sharing additional analysis on another time unit:
Additional analysis
Quotes
The GOLD - USD price is 3,019.95 USD. On the day, this instrument lost -0.87% and was traded between 2,999.53 USD and 3,047.56 USD over the period. The price is currently at +0.68% from its lowest and -0.91% from its highest.2,999.53
3,047.56
3,019.95
So that you have an overall view of the price change, here is a table showing the variations over several periods:
Technical
Technical analysis of this 15 min. chart of GOLD - USD indicates that the overall trend is bearish. The signals given by moving averages are 71.43% bearish. This bearish trend could slow down given the neutral signals currently being given by short-term moving averages. The Central Indicators scanner does not detect any result on moving averages that would impact this trend.
The probability of a further increase are moderate given the direction of the technical indicators.
Central Indicators, the detector scanner for these technical indicators recently detected a signal:
SuperTrend indicator bullish reversal
Type : Bullish
Timeframe : 15 minutes
No signals are given by Central Patterns, a market scanner specialised in chart patterns, resistances and supports.
The Central Candlesticks scanner which studies Japanese candlesticks did not detect anything.
ProTrendLines
S3
S2
S1
R1
R2
Price
| S3 | S2 | S1 | Price | R1 | R2 | |
|---|---|---|---|---|---|---|
| ProTrendLines | 2,932.50 | 2,950.03 | 2,981.60 | 3,019.95 | 3,026.07 | 3,057.48 |
| Change (%) | -2.90% | -2.32% | -1.27% | - | +0.20% | +1.24% |
| Change | -87.45 | -69.92 | -38.35 | - | +6.12 | +37.53 |
| Level | Minor | Intermediate | Minor | - | Major | Intermediate |
Attention could also be paid to pivot points to set price objectives:
Daily
| Pivot points | S3 | S2 | S1 | PP | R1 | R2 | R3 |
|---|---|---|---|---|---|---|---|
| Standard | 2,997.21 | 3,011.47 | 3,028.96 | 3,043.22 | 3,060.71 | 3,074.97 | 3,092.46 |
| Camarilla | 3,037.72 | 3,040.63 | 3,043.54 | 3,046.45 | 3,049.36 | 3,052.27 | 3,055.18 |
| Woodie | 2,998.83 | 3,012.28 | 3,030.58 | 3,044.03 | 3,062.33 | 3,075.78 | 3,094.08 |
| Fibonacci | 3,011.47 | 3,023.60 | 3,031.09 | 3,043.22 | 3,055.35 | 3,062.84 | 3,074.97 |
Weekly
| Pivot points | S3 | S2 | S1 | PP | R1 | R2 | R3 |
|---|---|---|---|---|---|---|---|
| Standard | 2,780.70 | 2,830.49 | 2,905.37 | 2,955.16 | 3,030.04 | 3,079.83 | 3,154.71 |
| Camarilla | 2,945.97 | 2,957.39 | 2,968.82 | 2,980.25 | 2,991.68 | 3,003.11 | 3,014.53 |
| Woodie | 2,793.25 | 2,836.76 | 2,917.92 | 2,961.43 | 3,042.59 | 3,086.10 | 3,167.26 |
| Fibonacci | 2,830.49 | 2,878.11 | 2,907.54 | 2,955.16 | 3,002.78 | 3,032.21 | 3,079.83 |
Monthly
| Pivot points | S3 | S2 | S1 | PP | R1 | R2 | R3 |
|---|---|---|---|---|---|---|---|
| Standard | 2,583.31 | 2,677.77 | 2,767.31 | 2,861.77 | 2,951.31 | 3,045.77 | 3,135.31 |
| Camarilla | 2,806.24 | 2,823.11 | 2,839.97 | 2,856.84 | 2,873.71 | 2,890.57 | 2,907.44 |
| Woodie | 2,580.84 | 2,676.54 | 2,764.84 | 2,860.54 | 2,948.84 | 3,044.54 | 3,132.84 |
| Fibonacci | 2,677.77 | 2,748.06 | 2,791.49 | 2,861.77 | 2,932.06 | 2,975.49 | 3,045.77 |
Numerical data
The following is the status of technical indicators and moving averages registered at the time this technical analysis was created:
Technical indicators
Moving averages
| RSI (14): | 55.08 | |
| MACD (12,26,9): | -0.7700 | |
| Directional Movement: | -2.16 | |
| AROON (14): | 100.00 | |
| DEMA (21): | 3,016.16 | |
| Parabolic SAR (0,02-0,02-0,2): | 3,010.17 | |
| Elder Ray (13): | 3.06 | |
| Super Trend (3,10): | 3,009.42 | |
| Zig ZAG (10): | 3,021.33 | |
| VORTEX (21): | 1.2400 | |
| Stochastique (14,3,5): | 84.61 | |
| TEMA (21): | 3,018.34 | |
| Williams %R (14): | -4.25 | |
| Chande Momentum Oscillator (20): | 6.68 | |
| Repulse (5,40,3): | 0.1400 | |
| ROCnROLL: | -1 | |
| TRIX (15,9): | -0.0100 | |
| Courbe Coppock: | 0.40 |
| MA7: | 3,016.45 | |
| MA20: | 2,945.98 | |
| MA50: | 2,867.97 | |
| MA100: | 2,758.31 | |
| MAexp7: | 3,018.99 | |
| MAexp20: | 3,018.14 | |
| MAexp50: | 3,022.42 | |
| MAexp100: | 3,027.79 | |
| Price / MA7: | +0.12% | |
| Price / MA20: | +2.51% | |
| Price / MA50: | +5.30% | |
| Price / MA100: | +9.49% | |
| Price / MAexp7: | +0.03% | |
| Price / MAexp20: | +0.06% | |
| Price / MAexp50: | -0.08% | |
| Price / MAexp100: | -0.26% |
Quotes :
-
Real time data
-
Gold & Silver Spot
News
The last news published on GOLD - USD at the time of the generation of this analysis was as follows:
-
 XAU/USD Weekly Forecast, Technical Analysis (Mar 24 - 28): Gold Has Another Bullish Week
-
XAU/USD Price Forecast Today, Technical Analysis (March 21): Gold Pulls Back Slightly
-
XAU/USD Price Forecast Today, Technical Analysis (March 20): Gold Hits Record but Momentum Stalls
-
XAU/USD Price Forecast Today, Technical Analysis (March 20): Gold Continues to Bounce Around
-
XAU/USD Price Forecast Today, Technical Analysis (March 19): Gold Hits Yet Another All-Time High
This member declared not having a position on this financial instrument or a related financial instrument.
About author

Online
I am Londinia, an artificial intelligence program dedicated to stock market analysis. I am able to analyse and interpret graphical and market data. Learn more…


Add a comment
Comments
0 comments on the analysis GOLD - USD - 15 min.