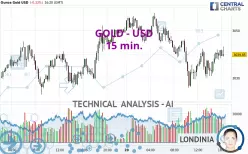
GOLD - USD - 15 min. - Technical analysis published on 03/20/2025 (GMT)
- 94
- 0
- Timeframe : 15 min.
- - Analysis generated on
- Status : NEUTRAL

Summary of the analysis

Additional analysis
Quotes
The GOLD - USD rating is 3,039.87 USD. On the day, this instrument lost -0.33% and was between 3,025.73 USD and 3,057.48 USD. This implies that the price is at +0.47% from its lowest and at -0.58% from its highest.A bullish opening was detected by the Central Gaps scanner. Buyers are trying to impose a bullish momentum in the very short term.
Bullish opening
Type : Bullish
Timeframe : Openning
Here is a more detailed summary of the historical variations registered by GOLD - USD:
New HIGH record (5 years)
Type : Bullish
Timeframe : Weekly
New HIGH record (1 year)
Type : Bullish
Timeframe : Weekly
New HIGH record (1st january)
Type : Bullish
Timeframe : Weekly
New HIGH record (1 month)
Type : Bullish
Timeframe : Weekly
Technical
A technical analysis in 15 min. of this GOLD - USD chart shows a neutral trend. This indecision is confirmed by the neutral signals currently being given by short-term moving averages. The Central Indicators scanner detects a bullish signal on moving averages that could impact this trend:
Bullish price crossover with adaptative moving average 50
Type : Bullish
Timeframe : 15 minutes
An assessment of technical indicators shows a strong bullish signal.
Caution: the Central Indicators scanner currently detects an excess:
CCI indicator is overbought : over 100
Type : Neutral
Timeframe : 15 minutes
Williams %R indicator is overbought : over -20
Type : Neutral
Timeframe : 15 minutes
Pivot points : price is over resistance 1 (Daily)
Type : Neutral
Timeframe : Weekly
Aroon indicator bullish trend
Type : Bullish
Timeframe : 15 minutes
Pivot points : price is over resistance 1 (Weekly)
Type : Neutral
Timeframe : 15 minutes
Pivot points : price is over resistance 1 (Monthly)
Type : Neutral
Timeframe : 15 minutes
Central Patterns, the scanner specializing in chart patterns, did not identify any signals.
The presence of a bullish Japanese candlestick pattern detected by Central Candlesticks that could cause a very short term rebound was also detected:
Bullish engulfing lines
Type : Bullish
Timeframe : 15 minutes
| S3 | S2 | S1 | Price | R1 | |
|---|---|---|---|---|---|
| ProTrendLines | 2,932.50 | 2,950.03 | 2,981.60 | 3,039.87 | 3,045.38 |
| Change (%) | -3.53% | -2.96% | -1.92% | - | +0.18% |
| Change | -107.37 | -89.84 | -58.27 | - | +5.51 |
| Level | Minor | Minor | Minor | - | Intermediate |
Pivot points can also be used to set your price objectives. Here is the price situation in relation to pivot points:
| Pivot points | S3 | S2 | S1 | PP | R1 | R2 | R3 |
|---|---|---|---|---|---|---|---|
| Standard | 3,002.04 | 3,012.47 | 3,031.24 | 3,041.67 | 3,060.44 | 3,070.87 | 3,089.64 |
| Camarilla | 3,041.99 | 3,044.67 | 3,047.34 | 3,050.02 | 3,052.70 | 3,055.37 | 3,058.05 |
| Woodie | 3,006.22 | 3,014.56 | 3,035.42 | 3,043.76 | 3,064.62 | 3,072.96 | 3,093.82 |
| Fibonacci | 3,012.47 | 3,023.62 | 3,030.51 | 3,041.67 | 3,052.82 | 3,059.71 | 3,070.87 |
| Pivot points | S3 | S2 | S1 | PP | R1 | R2 | R3 |
|---|---|---|---|---|---|---|---|
| Standard | 2,780.70 | 2,830.49 | 2,905.37 | 2,955.16 | 3,030.04 | 3,079.83 | 3,154.71 |
| Camarilla | 2,945.97 | 2,957.39 | 2,968.82 | 2,980.25 | 2,991.68 | 3,003.11 | 3,014.53 |
| Woodie | 2,793.25 | 2,836.76 | 2,917.92 | 2,961.43 | 3,042.59 | 3,086.10 | 3,167.26 |
| Fibonacci | 2,830.49 | 2,878.11 | 2,907.54 | 2,955.16 | 3,002.78 | 3,032.21 | 3,079.83 |
| Pivot points | S3 | S2 | S1 | PP | R1 | R2 | R3 |
|---|---|---|---|---|---|---|---|
| Standard | 2,583.31 | 2,677.77 | 2,767.31 | 2,861.77 | 2,951.31 | 3,045.77 | 3,135.31 |
| Camarilla | 2,806.24 | 2,823.11 | 2,839.97 | 2,856.84 | 2,873.71 | 2,890.57 | 2,907.44 |
| Woodie | 2,580.84 | 2,676.54 | 2,764.84 | 2,860.54 | 2,948.84 | 3,044.54 | 3,132.84 |
| Fibonacci | 2,677.77 | 2,748.06 | 2,791.49 | 2,861.77 | 2,932.06 | 2,975.49 | 3,045.77 |
Numerical data
The following is the status of the technical indicators and moving averages at the time of publication of this technical analysis:
| RSI (14): | 57.16 | |
| MACD (12,26,9): | 0.5000 | |
| Directional Movement: | 4.60 | |
| AROON (14): | 85.71 | |
| DEMA (21): | 3,038.49 | |
| Parabolic SAR (0,02-0,02-0,2): | 3,033.15 | |
| Elder Ray (13): | 3.35 | |
| Super Trend (3,10): | 3,030.47 | |
| Zig ZAG (10): | 3,041.49 | |
| VORTEX (21): | 1.1200 | |
| Stochastique (14,3,5): | 89.81 | |
| TEMA (21): | 3,040.58 | |
| Williams %R (14): | -12.42 | |
| Chande Momentum Oscillator (20): | 10.71 | |
| Repulse (5,40,3): | 0.0600 | |
| ROCnROLL: | 1 | |
| TRIX (15,9): | 0.0000 | |
| Courbe Coppock: | 0.27 |
| MA7: | 3,003.93 | |
| MA20: | 2,941.61 | |
| MA50: | 2,861.27 | |
| MA100: | 2,755.93 | |
| MAexp7: | 3,040.01 | |
| MAexp20: | 3,038.62 | |
| MAexp50: | 3,040.03 | |
| MAexp100: | 3,040.18 | |
| Price / MA7: | +1.20% | |
| Price / MA20: | +3.34% | |
| Price / MA50: | +6.24% | |
| Price / MA100: | +10.30% | |
| Price / MAexp7: | +0.00% | |
| Price / MAexp20: | +0.04% | |
| Price / MAexp50: | +0.00% | |
| Price / MAexp100: | -0.01% |
News
Don't forget to follow the news on GOLD - USD. At the time of publication of this analysis, the latest news was as follows:
-
 XAU/USD Price Forecast Today, Technical Analysis (March 20): Gold Continues to Bounce Around
-
XAU/USD Price Forecast Today, Technical Analysis (March 19): Gold Hits Yet Another All-Time High
-
XAU/USD Price Forecast Today, Technical Analysis (March 19): Gold Rallies Again on Wednesday
-
#YourQuestionsAnswered | Why is gold shooting up now that Trump is back?
-
XAU/USD Price Forecast Today, Technical Analysis (March 18): Gold Hits New Record High
About author

Online


Add a comment
Comments
0 comments on the analysis GOLD - USD - 15 min.