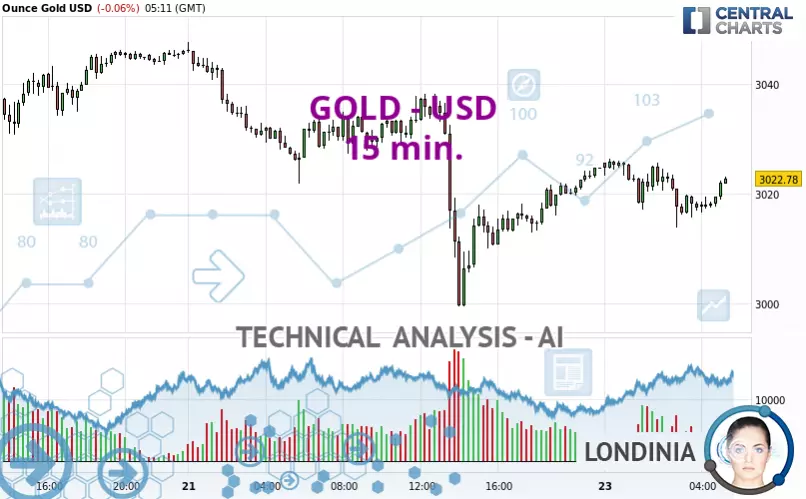
GOLD - USD - 15 min. - Technical analysis published on 03/24/2025 (GMT)
- 128
- 0
- Timeframe : 15 min.
- - Analysis generated on
- Status : NEUTRAL

Summary of the analysis

Additional analysis
Quotes
The GOLD - USD price is 3,022.96 USD. The price is lower by -0.06% since the last closing and was traded between 3,013.79 USD and 3,026.36 USD over the period. The price is currently at +0.30% from its lowest and -0.11% from its highest.The Central Gaps scanner detects a bullish opening marking the presence of buyers ahead of sellers at the opening but not sufficiently marked to allow the price to register a quotation gap.
Bullish opening
Type : Bullish
Timeframe : Openning
Here is a more detailed summary of the historical variations registered by GOLD - USD:
Near a new HIGH record (5 years)
Type : Bullish
Timeframe : Weekly
Near a new HIGH record (1 year)
Type : Bullish
Timeframe : Weekly
Near a new HIGH record (1st january)
Type : Bullish
Timeframe : Weekly
Near a new HIGH record (1 month)
Type : Bullish
Timeframe : Weekly
Technical
A technical analysis in 15 min. of this GOLD - USD chart shows a slightly bearish trend. 60.71% of the signals given by moving averages are bearish. Caution: the slightly bullish signals currently given by short-term moving averages could cause a reversal of the trend. The Central Indicators market scanner currently does not detect any result that concerns moving averages.
In fact, of the 18 technical indicators analysed by Central Analyzer, 5 are bullish, 7 are neutral and 6 are bearish. Central Indicators, the detector scanner for these technical indicators has recently detected several signals:
Ichimoku : price is over the cloud
Type : Bullish
Timeframe : 15 minutes
Price is back under the pivot point (Daily)
Type : Bearish
Timeframe : Weekly
Central Patterns, the scanner specializing in chart patterns, did not identify any signals.
The presence of these bearish patterns in Japanese candlesticks detected by Central Candlesticks that could cause a correction in the very short term were also noted
Bearish harami
Type : Bearish
Timeframe : 15 minutes
Bearish engulfing lines
Type : Bearish
Timeframe : 15 minutes
| S3 | S2 | S1 | Price | R1 | R2 | |
|---|---|---|---|---|---|---|
| ProTrendLines | 2,950.03 | 2,999.83 | 3,022.52 | 3,022.96 | 3,038.24 | 3,057.48 |
| Change (%) | -2.41% | -0.77% | -0.01% | - | +0.51% | +1.14% |
| Change | -72.93 | -23.13 | -0.44 | - | +15.28 | +34.52 |
| Level | Intermediate | Major | Minor | - | Intermediate | Minor |
Attention could also be paid to pivot points to set price objectives:
| Pivot points | S3 | S2 | S1 | PP | R1 | R2 | R3 |
|---|---|---|---|---|---|---|---|
| Standard | 2,952.24 | 2,975.88 | 3,000.27 | 3,023.91 | 3,048.30 | 3,071.94 | 3,096.33 |
| Camarilla | 3,011.44 | 3,015.85 | 3,020.25 | 3,024.65 | 3,029.05 | 3,033.46 | 3,037.86 |
| Woodie | 2,952.61 | 2,976.07 | 3,000.64 | 3,024.10 | 3,048.67 | 3,072.13 | 3,096.70 |
| Fibonacci | 2,975.88 | 2,994.23 | 3,005.57 | 3,023.91 | 3,042.26 | 3,053.60 | 3,071.94 |
| Pivot points | S3 | S2 | S1 | PP | R1 | R2 | R3 |
|---|---|---|---|---|---|---|---|
| Standard | 2,910.14 | 2,946.18 | 2,985.41 | 3,021.45 | 3,060.68 | 3,096.72 | 3,135.95 |
| Camarilla | 3,003.95 | 3,010.85 | 3,017.75 | 3,024.65 | 3,031.55 | 3,038.45 | 3,045.35 |
| Woodie | 2,911.75 | 2,946.98 | 2,987.02 | 3,022.25 | 3,062.29 | 3,097.52 | 3,137.56 |
| Fibonacci | 2,946.18 | 2,974.93 | 2,992.69 | 3,021.45 | 3,050.20 | 3,067.96 | 3,096.72 |
| Pivot points | S3 | S2 | S1 | PP | R1 | R2 | R3 |
|---|---|---|---|---|---|---|---|
| Standard | 2,583.31 | 2,677.77 | 2,767.31 | 2,861.77 | 2,951.31 | 3,045.77 | 3,135.31 |
| Camarilla | 2,806.24 | 2,823.11 | 2,839.97 | 2,856.84 | 2,873.71 | 2,890.57 | 2,907.44 |
| Woodie | 2,580.84 | 2,676.54 | 2,764.84 | 2,860.54 | 2,948.84 | 3,044.54 | 3,132.84 |
| Fibonacci | 2,677.77 | 2,748.06 | 2,791.49 | 2,861.77 | 2,932.06 | 2,975.49 | 3,045.77 |
Numerical data
The following are the details of the technical indicators and moving averages that were collected to generate this technical analysis:
| RSI (14): | 45.79 | |
| MACD (12,26,9): | -1.0200 | |
| Directional Movement: | -9.64 | |
| AROON (14): | -35.71 | |
| DEMA (21): | 3,018.41 | |
| Parabolic SAR (0,02-0,02-0,2): | 3,022.24 | |
| Elder Ray (13): | -0.70 | |
| Super Trend (3,10): | 3,025.80 | |
| Zig ZAG (10): | 3,018.12 | |
| VORTEX (21): | 0.9000 | |
| Stochastique (14,3,5): | 38.52 | |
| TEMA (21): | 3,017.90 | |
| Williams %R (14): | -47.18 | |
| Chande Momentum Oscillator (20): | -1.62 | |
| Repulse (5,40,3): | 0.0600 | |
| ROCnROLL: | -1 | |
| TRIX (15,9): | 0.0000 | |
| Courbe Coppock: | 0.26 |
| MA7: | 3,021.84 | |
| MA20: | 2,949.64 | |
| MA50: | 2,875.07 | |
| MA100: | 2,761.07 | |
| MAexp7: | 3,018.90 | |
| MAexp20: | 3,019.49 | |
| MAexp50: | 3,021.10 | |
| MAexp100: | 3,024.73 | |
| Price / MA7: | +0.04% | |
| Price / MA20: | +2.49% | |
| Price / MA50: | +5.14% | |
| Price / MA100: | +9.49% | |
| Price / MAexp7: | +0.13% | |
| Price / MAexp20: | +0.12% | |
| Price / MAexp50: | +0.06% | |
| Price / MAexp100: | -0.06% |
News
The last news published on GOLD - USD at the time of the generation of this analysis was as follows:
-
 XAU/USD Price Forecast Today, Technical Analysis (March 21): Gold Faces Bearish Reversal
-
XAU/USD Weekly Forecast, Technical Analysis (Mar 24 - 28): Gold Has Another Bullish Week
-
XAU/USD Price Forecast Today, Technical Analysis (March 21): Gold Pulls Back Slightly
-
XAU/USD Price Forecast Today, Technical Analysis (March 20): Gold Hits Record but Momentum Stalls
-
XAU/USD Price Forecast Today, Technical Analysis (March 20): Gold Continues to Bounce Around
About author

Online


Add a comment
Comments
0 comments on the analysis GOLD - USD - 15 min.