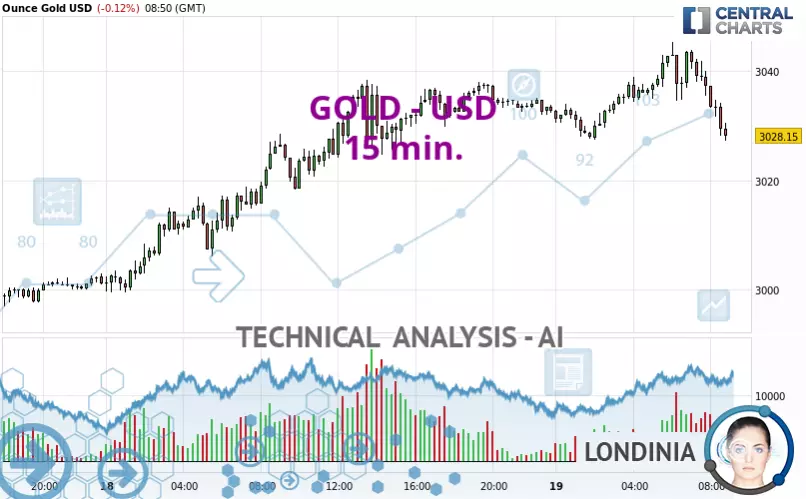
GOLD - USD - 15 min. - Technical analysis published on 03/19/2025 (GMT)
- 87
- 0
Click here for a new analysis!
- Timeframe : 15 min.
- - Analysis generated on
- Status : LEVEL MAINTAINED

Summary of the analysis

Additional analysis
Quotes
The GOLD - USD price is 3,028.13 USD. The price registered a decrease of -0.12% on the session and was traded between 3,027.31 USD and 3,045.38 USD over the period. The price is currently at +0.03% from its lowest and -0.57% from its highest.So that you have an overall view of the price change, here is a table showing the variations over several periods:
Technical
Technical analysis of GOLD - USD in 15 min. shows an overall bullish trend. 67.86% of the signals given by moving averages are bullish. Caution: the slightly bearish signals currently being given by short-term moving averages indicate that this bullish trend may be running out of steam. The Central Indicators scanner detects bullish and bearish signals on moving averages that could impact this trend:
Bearish trend reversal : Moving Average 20
Type : Bearish
Timeframe : 15 minutes
Bearish trend reversal : Moving Average 50
Type : Bearish
Timeframe : 15 minutes
Bearish trend reversal : adaptative moving average 50
Type : Bearish
Timeframe : 15 minutes
Bullish price crossover with adaptative moving average 50
Type : Bullish
Timeframe : 15 minutes
Bullish price crossover with adaptative moving average 100
Type : Bullish
Timeframe : 15 minutes
In fact, 12 technical indicators on 18 studied are currently positioned bullish. But beware of excesses. The Central Indicators scanner currently detects this:
CCI indicator is oversold : under -100
Type : Neutral
Timeframe : 15 minutes
Williams %R indicator is oversold : under -80
Type : Neutral
Timeframe : 15 minutes
No signals are given by Central Patterns, a market scanner specialised in chart patterns, resistances and supports.
For a small rebound in the very short term, the Central Candlesticks scanner currently notes the presence of this bullish pattern in Japanese candlesticks:
Bullish harami
Type : Bullish
Timeframe : 15 minutes
| S3 | S2 | S1 | Price | R1 | |
|---|---|---|---|---|---|
| ProTrendLines | 2,930.38 | 2,950.03 | 2,999.82 | 3,028.13 | 3,038.32 |
| Change (%) | -3.23% | -2.58% | -0.93% | - | +0.34% |
| Change | -97.75 | -78.10 | -28.31 | - | +10.19 |
| Level | Minor | Minor | Intermediate | - | Intermediate |
Attention could also be paid to pivot points to set price objectives:
| Pivot points | S3 | S2 | S1 | PP | R1 | R2 | R3 |
|---|---|---|---|---|---|---|---|
| Standard | 2,969.16 | 2,984.31 | 3,008.09 | 3,023.24 | 3,047.02 | 3,062.17 | 3,085.95 |
| Camarilla | 3,021.16 | 3,024.73 | 3,028.30 | 3,031.87 | 3,035.44 | 3,039.01 | 3,042.58 |
| Woodie | 2,973.48 | 2,986.47 | 3,012.41 | 3,025.40 | 3,051.34 | 3,064.33 | 3,090.27 |
| Fibonacci | 2,984.31 | 2,999.18 | 3,008.37 | 3,023.24 | 3,038.11 | 3,047.30 | 3,062.17 |
| Pivot points | S3 | S2 | S1 | PP | R1 | R2 | R3 |
|---|---|---|---|---|---|---|---|
| Standard | 2,780.70 | 2,830.49 | 2,905.37 | 2,955.16 | 3,030.04 | 3,079.83 | 3,154.71 |
| Camarilla | 2,945.97 | 2,957.39 | 2,968.82 | 2,980.25 | 2,991.68 | 3,003.11 | 3,014.53 |
| Woodie | 2,793.25 | 2,836.76 | 2,917.92 | 2,961.43 | 3,042.59 | 3,086.10 | 3,167.26 |
| Fibonacci | 2,830.49 | 2,878.11 | 2,907.54 | 2,955.16 | 3,002.78 | 3,032.21 | 3,079.83 |
| Pivot points | S3 | S2 | S1 | PP | R1 | R2 | R3 |
|---|---|---|---|---|---|---|---|
| Standard | 2,583.31 | 2,677.77 | 2,767.31 | 2,861.77 | 2,951.31 | 3,045.77 | 3,135.31 |
| Camarilla | 2,806.24 | 2,823.11 | 2,839.97 | 2,856.84 | 2,873.71 | 2,890.57 | 2,907.44 |
| Woodie | 2,580.84 | 2,676.54 | 2,764.84 | 2,860.54 | 2,948.84 | 3,044.54 | 3,132.84 |
| Fibonacci | 2,677.77 | 2,748.06 | 2,791.49 | 2,861.77 | 2,932.06 | 2,975.49 | 3,045.77 |
Numerical data
The following are the details of the technical indicators and moving averages that were collected to generate this technical analysis:
| RSI (14): | 61.28 | |
| MACD (12,26,9): | 0.5500 | |
| Directional Movement: | 10.38 | |
| AROON (14): | 57.14 | |
| DEMA (21): | 3,033.59 | |
| Parabolic SAR (0,02-0,02-0,2): | 3,029.64 | |
| Elder Ray (13): | 3.01 | |
| Super Trend (3,10): | 3,029.81 | |
| Zig ZAG (10): | 3,037.60 | |
| VORTEX (21): | 1.0500 | |
| Stochastique (14,3,5): | 87.41 | |
| TEMA (21): | 3,033.98 | |
| Williams %R (14): | -17.16 | |
| Chande Momentum Oscillator (20): | 7.01 | |
| Repulse (5,40,3): | 0.0200 | |
| ROCnROLL: | 1 | |
| TRIX (15,9): | 0.0000 | |
| Courbe Coppock: | 0.16 |
| MA7: | 2,984.04 | |
| MA20: | 2,935.93 | |
| MA50: | 2,853.56 | |
| MA100: | 2,753.12 | |
| MAexp7: | 3,034.46 | |
| MAexp20: | 3,032.72 | |
| MAexp50: | 3,031.45 | |
| MAexp100: | 3,025.72 | |
| Price / MA7: | +1.48% | |
| Price / MA20: | +3.14% | |
| Price / MA50: | +6.12% | |
| Price / MA100: | +9.99% | |
| Price / MAexp7: | -0.21% | |
| Price / MAexp20: | -0.15% | |
| Price / MAexp50: | -0.11% | |
| Price / MAexp100: | +0.08% |
News
The last news published on GOLD - USD at the time of the generation of this analysis was as follows:
-
 XAU/USD Price Forecast Today, Technical Analysis (March 18): Gold Hits New Record High
-
Gold Analysis: Is Gold Going to Make it to $3300?
-
Gold (XAU/USD) Daily Price Forecast and Technical Analysis, March 18, 2025, #gold #xauusd #xau
-
XAU/USD Price Forecast Today, Technical Analysis (March 17): Gold Attemps to Break Above $3000
-
XAU/USD Price Forecast Today, Technical Analysis (March 14): Gold Rallied to a New Record High
About author

Online


Add a comment
Comments
0 comments on the analysis GOLD - USD - 15 min.