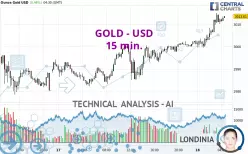
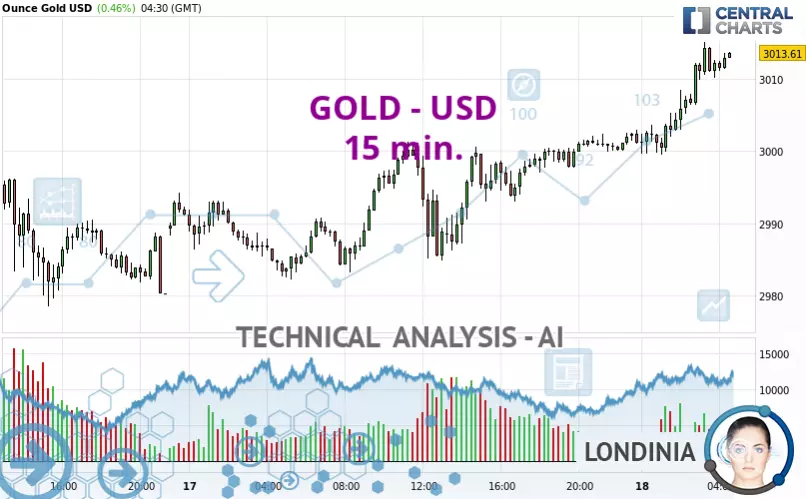
GOLD - USD - 15 min. - Technical analysis published on 03/18/2025 (GMT)
- 113
- 0
Click here for a new analysis!
- Timeframe : 15 min.
- - Analysis generated on
- Status : TARGET REACHED
Summary of the analysis

Additional analysis
Quotes
The GOLD - USD price is 3,013.61 USD. The price has increased by +0.46% since the last closing and was traded between 2,999.46 USD and 3,015.10 USD over the period. The price is currently at +0.47% from its lowest and -0.05% from its highest.The Central Gaps scanner detects a bullish opening. A small advantage for buyers in the very short term.
Bullish opening
Type : Bullish
Timeframe : Openning
Here is a more detailed summary of the historical variations registered by GOLD - USD:
New HIGH record (5 years)
Type : Bullish
Timeframe : Weekly
New HIGH record (1 year)
Type : Bullish
Timeframe : Weekly
New HIGH record (1st january)
Type : Bullish
Timeframe : Weekly
New HIGH record (1 month)
Type : Bullish
Timeframe : Weekly
Technical
A technical analysis in 15 min. of this GOLD - USD chart shows a strongly bullish trend. 92.86% of the signals given by moving averages are bullish. This strongly bullish trend is supported by the strong bullish signals given by short-term moving averages. The Central Indicators scanner does not detect any result on moving averages that would impact this trend.
An assessment of technical indicators shows a strong bullish signal.
Caution: the Central Indicators scanner currently detects an excess:
RSI indicator is overbought : over 70
Type : Neutral
Timeframe : 15 minutes
Williams %R indicator is overbought : over -20
Type : Neutral
Timeframe : 15 minutes
Pivot points : price is over resistance 1 (Daily)
Type : Neutral
Timeframe : 15 minutes
Central Patterns, the scanner specializing in chart patterns, did not identify any signals.
The Central Candlesticks scanner, specialised in Japanese candlesticks, did not identify any signals.
| S3 | S2 | S1 | Price | |
|---|---|---|---|---|
| ProTrendLines | 2,950.03 | 2,984.89 | 3,004.95 | 3,013.61 |
| Change (%) | -2.11% | -0.95% | -0.29% | - |
| Change | -63.58 | -28.72 | -8.66 | - |
| Level | Minor | Minor | Intermediate | - |
Attention could also be paid to pivot points to set price objectives:
| Pivot points | S3 | S2 | S1 | PP | R1 | R2 | R3 |
|---|---|---|---|---|---|---|---|
| Standard | 2,966.39 | 2,974.30 | 2,987.08 | 2,994.99 | 3,007.77 | 3,015.68 | 3,028.46 |
| Camarilla | 2,994.17 | 2,996.07 | 2,997.96 | 2,999.86 | 3,001.76 | 3,003.65 | 3,005.55 |
| Woodie | 2,968.83 | 2,975.52 | 2,989.52 | 2,996.21 | 3,010.21 | 3,016.90 | 3,030.90 |
| Fibonacci | 2,974.30 | 2,982.20 | 2,987.09 | 2,994.99 | 3,002.89 | 3,007.78 | 3,015.68 |
| Pivot points | S3 | S2 | S1 | PP | R1 | R2 | R3 |
|---|---|---|---|---|---|---|---|
| Standard | 2,780.70 | 2,830.49 | 2,905.37 | 2,955.16 | 3,030.04 | 3,079.83 | 3,154.71 |
| Camarilla | 2,945.97 | 2,957.39 | 2,968.82 | 2,980.25 | 2,991.68 | 3,003.11 | 3,014.53 |
| Woodie | 2,793.25 | 2,836.76 | 2,917.92 | 2,961.43 | 3,042.59 | 3,086.10 | 3,167.26 |
| Fibonacci | 2,830.49 | 2,878.11 | 2,907.54 | 2,955.16 | 3,002.78 | 3,032.21 | 3,079.83 |
| Pivot points | S3 | S2 | S1 | PP | R1 | R2 | R3 |
|---|---|---|---|---|---|---|---|
| Standard | 2,583.31 | 2,677.77 | 2,767.31 | 2,861.77 | 2,951.31 | 3,045.77 | 3,135.31 |
| Camarilla | 2,806.24 | 2,823.11 | 2,839.97 | 2,856.84 | 2,873.71 | 2,890.57 | 2,907.44 |
| Woodie | 2,580.84 | 2,676.54 | 2,764.84 | 2,860.54 | 2,948.84 | 3,044.54 | 3,132.84 |
| Fibonacci | 2,677.77 | 2,748.06 | 2,791.49 | 2,861.77 | 2,932.06 | 2,975.49 | 3,045.77 |
Numerical data
The following is the status of the technical indicators and moving averages at the time of publication of this technical analysis:
| RSI (14): | 73.45 | |
| MACD (12,26,9): | 3.2800 | |
| Directional Movement: | 24.34 | |
| AROON (14): | 64.29 | |
| DEMA (21): | 3,011.69 | |
| Parabolic SAR (0,02-0,02-0,2): | 3,008.19 | |
| Elder Ray (13): | 2.94 | |
| Super Trend (3,10): | 3,004.29 | |
| Zig ZAG (10): | 3,013.26 | |
| VORTEX (21): | 1.1900 | |
| Stochastique (14,3,5): | 81.80 | |
| TEMA (21): | 3,013.19 | |
| Williams %R (14): | -11.70 | |
| Chande Momentum Oscillator (20): | 8.52 | |
| Repulse (5,40,3): | 0.0600 | |
| ROCnROLL: | 1 | |
| TRIX (15,9): | 0.0100 | |
| Courbe Coppock: | 0.64 |
| MA7: | 2,959.72 | |
| MA20: | 2,929.87 | |
| MA50: | 2,845.69 | |
| MA100: | 2,750.00 | |
| MAexp7: | 3,011.28 | |
| MAexp20: | 3,007.57 | |
| MAexp50: | 3,002.82 | |
| MAexp100: | 2,998.02 | |
| Price / MA7: | +1.82% | |
| Price / MA20: | +2.86% | |
| Price / MA50: | +5.90% | |
| Price / MA100: | +9.59% | |
| Price / MAexp7: | +0.08% | |
| Price / MAexp20: | +0.20% | |
| Price / MAexp50: | +0.36% | |
| Price / MAexp100: | +0.52% |
News
The latest news and videos published on GOLD - USD at the time of the analysis were as follows:
-
 XAU/USD Price Forecast Today, Technical Analysis (March 17): Gold Attemps to Break Above $3000
-
XAU/USD Price Forecast Today, Technical Analysis (March 14): Gold Rallied to a New Record High
-
XAU/USD Price Forecast Today, Technical Analysis (March 13): Gold Breaks Out to Record Highs
-
XAU/USD Price Forecast Today, Technical Analysis (March 13): Gold Continues to Climb
-
XAU/USD Price Forecast Today, Technical Analysis (March 12): Gold Eyes New Record Highs
About author

Online


Add a comment
Comments
0 comments on the analysis GOLD - USD - 15 min.