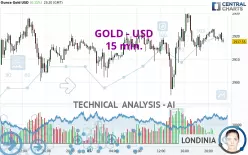
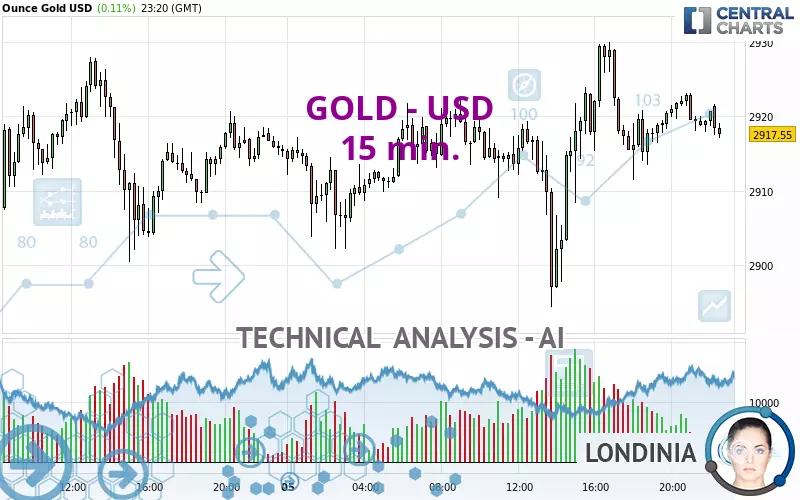
GOLD - USD - 15 min. - Technical analysis published on 03/05/2025 (GMT)
- 126
- 0
Click here for a new analysis!
- Timeframe : 15 min.
- - Analysis generated on
- Status : LEVEL MAINTAINED
Summary of the analysis

Additional analysis
Quotes
The GOLD - USD price is 2,917.52 USD. The price registered an increase of +0.11% on the session with the lowest point at 2,894.37 USD and the highest point at 2,929.96 USD. The deviation from the price is +0.80% for the low point and -0.42% for the high point.The Central Gaps scanner detects a bullish opening. A small advantage for buyers in the very short term.
Bullish opening
Type : Bullish
Timeframe : Openning
So that you have an overall view of the price change, here is a table showing the variations over several periods:
Near a new HIGH record (5 years)
Type : Bullish
Timeframe : Weekly
Near a new HIGH record (1 year)
Type : Bullish
Timeframe : Weekly
Near a new HIGH record (1st january)
Type : Bullish
Timeframe : Weekly
Near a new LOW record (1 month)
Type : Bearish
Timeframe : Weekly
Technical
A technical analysis in 15 min. of this GOLD - USD chart shows a bullish trend. 71.43% of the signals given by moving averages are bullish. Caution: the neutral signals currently given by short-term moving averages show us that the global trend is losing momentum. The Central Indicators scanner detects a bearish signal on moving averages that could impact this trend:
Bearish price crossover with Moving Average 20
Type : Bearish
Timeframe : 15 minutes
Technical indicators are slightly bullish. There is therefore considerable uncertainty about the continuation of the increase.
Caution: the Central Indicators scanner currently detects an excess:
MACD indicator: bearish divergence
Type : Bearish
Timeframe : 15 minutes
Price is back over the pivot point
Type : Bullish
Timeframe : Weekly
The analysis of the price chart with Central Patterns scanners does not return any result.
The Central Candlesticks scanner which studies Japanese candlesticks did not detect anything.
| S3 | S2 | S1 | Price | R1 | R2 | R3 | |
|---|---|---|---|---|---|---|---|
| ProTrendLines | 2,832.65 | 2,883.61 | 2,900.45 | 2,917.52 | 2,921.10 | 2,930.40 | 2,950.03 |
| Change (%) | -2.91% | -1.16% | -0.59% | - | +0.12% | +0.44% | +1.11% |
| Change | -84.87 | -33.91 | -17.07 | - | +3.58 | +12.88 | +32.51 |
| Level | Intermediate | Major | Minor | - | Intermediate | Minor | Major |
To determine price objectives, it is also possible to use the pivot points. Here is the price position in relation to pivot points:
| Pivot points | S3 | S2 | S1 | PP | R1 | R2 | R3 |
|---|---|---|---|---|---|---|---|
| Standard | 2,842.22 | 2,862.08 | 2,888.20 | 2,908.06 | 2,934.18 | 2,954.04 | 2,980.16 |
| Camarilla | 2,901.69 | 2,905.90 | 2,910.12 | 2,914.33 | 2,918.55 | 2,922.76 | 2,926.98 |
| Woodie | 2,845.36 | 2,863.65 | 2,891.34 | 2,909.63 | 2,937.32 | 2,955.61 | 2,983.30 |
| Fibonacci | 2,862.08 | 2,879.64 | 2,890.49 | 2,908.06 | 2,925.62 | 2,936.47 | 2,954.04 |
| Pivot points | S3 | S2 | S1 | PP | R1 | R2 | R3 |
|---|---|---|---|---|---|---|---|
| Standard | 2,683.99 | 2,758.32 | 2,807.58 | 2,881.91 | 2,931.17 | 3,005.50 | 3,054.76 |
| Camarilla | 2,822.85 | 2,834.18 | 2,845.51 | 2,856.84 | 2,868.17 | 2,879.50 | 2,890.83 |
| Woodie | 2,671.46 | 2,752.05 | 2,795.05 | 2,875.64 | 2,918.64 | 2,999.23 | 3,042.23 |
| Fibonacci | 2,758.32 | 2,805.53 | 2,834.70 | 2,881.91 | 2,929.12 | 2,958.29 | 3,005.50 |
| Pivot points | S3 | S2 | S1 | PP | R1 | R2 | R3 |
|---|---|---|---|---|---|---|---|
| Standard | 2,583.31 | 2,677.77 | 2,767.31 | 2,861.77 | 2,951.31 | 3,045.77 | 3,135.31 |
| Camarilla | 2,806.24 | 2,823.11 | 2,839.97 | 2,856.84 | 2,873.71 | 2,890.57 | 2,907.44 |
| Woodie | 2,580.84 | 2,676.54 | 2,764.84 | 2,860.54 | 2,948.84 | 3,044.54 | 3,132.84 |
| Fibonacci | 2,677.77 | 2,748.06 | 2,791.49 | 2,861.77 | 2,932.06 | 2,975.49 | 3,045.77 |
Numerical data
The following are the details of the technical indicators and moving averages that were collected to generate this technical analysis:
| RSI (14): | 54.11 | |
| MACD (12,26,9): | 0.8800 | |
| Directional Movement: | -4.51 | |
| AROON (14): | 64.29 | |
| DEMA (21): | 2,920.71 | |
| Parabolic SAR (0,02-0,02-0,2): | 2,912.59 | |
| Elder Ray (13): | 0.16 | |
| Super Trend (3,10): | 2,912.17 | |
| Zig ZAG (10): | 2,920.64 | |
| VORTEX (21): | 0.9500 | |
| Stochastique (14,3,5): | 63.34 | |
| TEMA (21): | 2,920.73 | |
| Williams %R (14): | -30.78 | |
| Chande Momentum Oscillator (20): | 3.28 | |
| Repulse (5,40,3): | 0.0900 | |
| ROCnROLL: | 1 | |
| TRIX (15,9): | 0.0100 | |
| Courbe Coppock: | 0.19 |
| MA7: | 2,899.06 | |
| MA20: | 2,907.38 | |
| MA50: | 2,788.54 | |
| MA100: | 2,728.83 | |
| MAexp7: | 2,920.13 | |
| MAexp20: | 2,919.45 | |
| MAexp50: | 2,917.76 | |
| MAexp100: | 2,914.95 | |
| Price / MA7: | +0.64% | |
| Price / MA20: | +0.35% | |
| Price / MA50: | +4.63% | |
| Price / MA100: | +6.91% | |
| Price / MAexp7: | -0.09% | |
| Price / MAexp20: | -0.07% | |
| Price / MAexp50: | -0.01% | |
| Price / MAexp100: | +0.09% |
News
Don't forget to follow the news on GOLD - USD. At the time of publication of this analysis, the latest news was as follows:
-
 XAU/USD Price Forecast Today, Technical Analysis (March 05): Gold Tests Resistance on Wednesday
-
XAU/USD Price Forecast Today, Technical Analysis (March 05): Gold Bounces After Initial Pullback
-
Technical Outlook on EURUSD, USDJPY, Gold
-
XAU/USD Price Forecast Today, Technical Analysis (March 04): Gold Continues to Power Higher
-
XAU/USD Price Forecast Today, Technical Analysis (March 03): Gold Rallies to Kick Off the Week
About author

Online


Add a comment
Comments
0 comments on the analysis GOLD - USD - 15 min.