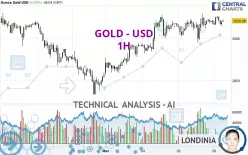
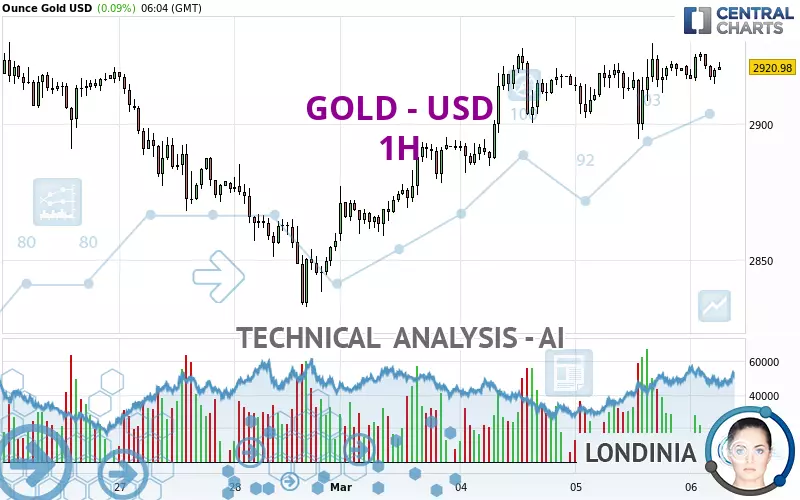
GOLD - USD - 1H - Technical analysis published on 03/06/2025 (GMT)
- 85
- 0
- Timeframe : 1H
- - Analysis generated on
- Status : IN PROGRESS...
Summary of the analysis

Additional analysis
Quotes
GOLD - USD rating 2,920.98 USD. On the day, this instrument gained +0.10% with the lowest point at 2,914.58 USD and the highest point at 2,926.62 USD. The deviation from the price is +0.22% for the low point and -0.19% for the high point.The Central Gaps scanner detects a bearish opening marking the presence of sellers ahead of buyers at the opening but not sufficiently marked to allow the price to register a quotation gap.
Bearish opening
Type : Bearish
Timeframe : Openning
Here is a more detailed summary of the historical variations registered by GOLD - USD:
Near a new HIGH record (5 years)
Type : Bullish
Timeframe : Weekly
Near a new HIGH record (1 year)
Type : Bullish
Timeframe : Weekly
Near a new HIGH record (1st january)
Type : Bullish
Timeframe : Weekly
Near a new LOW record (1 month)
Type : Bearish
Timeframe : Weekly
Technical
Technical analysis of GOLD - USD in 1H shows a strongly overall bullish trend. The signals given by moving averages are 85.71% bullish. This strongly bullish trend seems to be running out of steam given the signals being given by short-term moving averages. The Central Indicators market scanner is currently detecting a bearish signal that could impact this trend:
Bearish trend reversal : adaptative moving average 20
Type : Bearish
Timeframe : 1 hour
An assessment of technical indicators does not currently provide any relevant information on the direction of future price movements.
Other results related to technical indicators were also found by the Central Indicators scanner:
RSI indicator is back under 50
Type : Bearish
Timeframe : 1 hour
Price is back over the pivot point
Type : Bullish
Timeframe : Weekly
Momentum indicator is back over 0
Type : Bullish
Timeframe : 1 hour
Central Patterns, the scanner specializing in chart patterns, did not identify any signals.
There is also a Japanese candlestick pattern detected by Central Candlesticks that could mark the end of the current short-term trend:
Doji
Type : Neutral
Timeframe : 1 hour
| S3 | S2 | S1 | Price | R1 | R2 | |
|---|---|---|---|---|---|---|
| ProTrendLines | 2,883.61 | 2,894.71 | 2,916.76 | 2,920.98 | 2,930.26 | 2,950.03 |
| Change (%) | -1.28% | -0.90% | -0.14% | - | +0.32% | +0.99% |
| Change | -37.37 | -26.27 | -4.22 | - | +9.28 | +29.05 |
| Level | Intermediate | Major | Minor | - | Major | Major |
Attention could also be paid to pivot points to set price objectives:
| Pivot points | S3 | S2 | S1 | PP | R1 | R2 | R3 |
|---|---|---|---|---|---|---|---|
| Standard | 2,862.81 | 2,878.59 | 2,898.40 | 2,914.18 | 2,933.99 | 2,949.77 | 2,969.58 |
| Camarilla | 2,908.42 | 2,911.69 | 2,914.95 | 2,918.21 | 2,921.47 | 2,924.74 | 2,928.00 |
| Woodie | 2,864.83 | 2,879.60 | 2,900.42 | 2,915.19 | 2,936.01 | 2,950.78 | 2,971.60 |
| Fibonacci | 2,878.59 | 2,892.19 | 2,900.59 | 2,914.18 | 2,927.78 | 2,936.18 | 2,949.77 |
| Pivot points | S3 | S2 | S1 | PP | R1 | R2 | R3 |
|---|---|---|---|---|---|---|---|
| Standard | 2,683.99 | 2,758.32 | 2,807.58 | 2,881.91 | 2,931.17 | 3,005.50 | 3,054.76 |
| Camarilla | 2,822.85 | 2,834.18 | 2,845.51 | 2,856.84 | 2,868.17 | 2,879.50 | 2,890.83 |
| Woodie | 2,671.46 | 2,752.05 | 2,795.05 | 2,875.64 | 2,918.64 | 2,999.23 | 3,042.23 |
| Fibonacci | 2,758.32 | 2,805.53 | 2,834.70 | 2,881.91 | 2,929.12 | 2,958.29 | 3,005.50 |
| Pivot points | S3 | S2 | S1 | PP | R1 | R2 | R3 |
|---|---|---|---|---|---|---|---|
| Standard | 2,583.31 | 2,677.77 | 2,767.31 | 2,861.77 | 2,951.31 | 3,045.77 | 3,135.31 |
| Camarilla | 2,806.24 | 2,823.11 | 2,839.97 | 2,856.84 | 2,873.71 | 2,890.57 | 2,907.44 |
| Woodie | 2,580.84 | 2,676.54 | 2,764.84 | 2,860.54 | 2,948.84 | 3,044.54 | 3,132.84 |
| Fibonacci | 2,677.77 | 2,748.06 | 2,791.49 | 2,861.77 | 2,932.06 | 2,975.49 | 3,045.77 |
Numerical data
The following are the details of the technical indicators and moving averages that were collected to generate this technical analysis:
| RSI (14): | 49.06 | |
| MACD (12,26,9): | 2.1700 | |
| Directional Movement: | -6.67 | |
| AROON (14): | 7.14 | |
| DEMA (21): | 2,921.47 | |
| Parabolic SAR (0,02-0,02-0,2): | 2,909.37 | |
| Elder Ray (13): | -2.60 | |
| Super Trend (3,10): | 2,902.64 | |
| Zig ZAG (10): | 2,916.12 | |
| VORTEX (21): | 0.9900 | |
| Stochastique (14,3,5): | 46.45 | |
| TEMA (21): | 2,919.82 | |
| Williams %R (14): | -76.53 | |
| Chande Momentum Oscillator (20): | -0.31 | |
| Repulse (5,40,3): | -0.2000 | |
| ROCnROLL: | -1 | |
| TRIX (15,9): | 0.0100 | |
| Courbe Coppock: | 0.37 |
| MA7: | 2,898.76 | |
| MA20: | 2,910.26 | |
| MA50: | 2,794.52 | |
| MA100: | 2,731.38 | |
| MAexp7: | 2,919.23 | |
| MAexp20: | 2,918.11 | |
| MAexp50: | 2,911.31 | |
| MAexp100: | 2,904.81 | |
| Price / MA7: | +0.77% | |
| Price / MA20: | +0.37% | |
| Price / MA50: | +4.53% | |
| Price / MA100: | +6.94% | |
| Price / MAexp7: | +0.06% | |
| Price / MAexp20: | +0.10% | |
| Price / MAexp50: | +0.33% | |
| Price / MAexp100: | +0.56% |
News
Don't forget to follow the news on GOLD - USD. At the time of publication of this analysis, the latest news was as follows:
-
 XAU/USD Price Forecast Today, Technical Analysis (March 05): Gold Tests Resistance on Wednesday
-
XAU/USD Price Forecast Today, Technical Analysis (March 05): Gold Bounces After Initial Pullback
-
Technical Outlook on EURUSD, USDJPY, Gold
-
XAU/USD Price Forecast Today, Technical Analysis (March 04): Gold Continues to Power Higher
-
XAU/USD Price Forecast Today, Technical Analysis (March 03): Gold Rallies to Kick Off the Week
About author

Online


Add a comment
Comments
0 comments on the analysis GOLD - USD - 1H