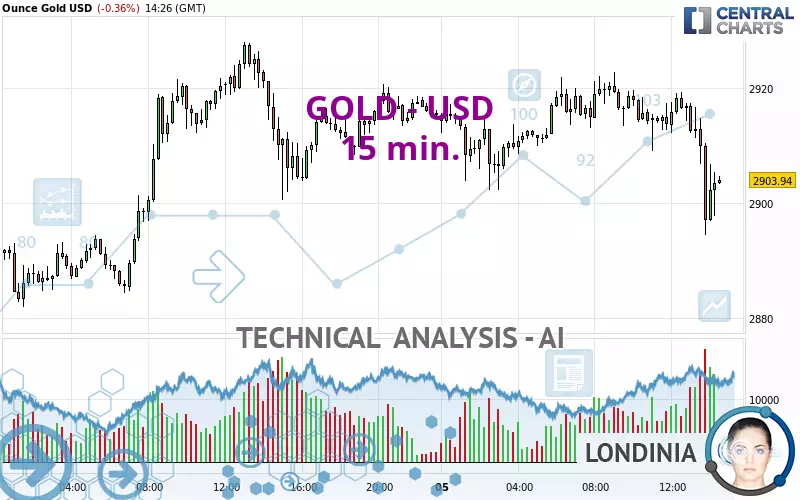
GOLD - USD - 15 min. - Technical analysis published on 03/05/2025 (GMT)
- 45
- 0
Click here for a new analysis!
- Timeframe : 15 min.
- - Analysis generated on
- Status : INVALID

Summary of the analysis

Additional analysis
Quotes
The GOLD - USD price is 2,903.79 USD. The price registered a decrease of -0.36% on the session with the lowest point at 2,894.37 USD and the highest point at 2,922.62 USD. The deviation from the price is +0.33% for the low point and -0.64% for the high point.The Central Gaps scanner detects a bullish opening marking the presence of buyers ahead of sellers at the opening but not sufficiently marked to allow the price to register a quotation gap.
Bullish opening
Type : Bullish
Timeframe : Openning
A study of price movements over other periods shows the following variations:
Near a new HIGH record (5 years)
Type : Bullish
Timeframe : Weekly
Near a new HIGH record (1 year)
Type : Bullish
Timeframe : Weekly
Near a new HIGH record (1st january)
Type : Bullish
Timeframe : Weekly
Near a new LOW record (1 month)
Type : Bearish
Timeframe : Weekly
Technical
A technical analysis in 15 min. of this GOLD - USD chart shows a sharp bearish trend. 85.71% of the signals given by moving averages are bearish. This strongly bearish trend is supported by the strong bearish signals given by short-term moving averages. The Central Indicators scanner does not detect any result on moving averages that would impact this trend.
In fact, Central Analyzer took into account 18 technical indicators and the result was as follows: 4 are bullish, 2 are neutral and 12 are bearish. But beware of excesses. The Central Indicators scanner currently detects this:
CCI indicator is oversold : under -100
Type : Neutral
Timeframe : 15 minutes
Price is back over the pivot point
Type : Bullish
Timeframe : Weekly
The analysis of the price chart with Central Patterns scanners does not return any result.
The Central Candlesticks scanner which studies Japanese candlesticks did not detect anything.
| S3 | S2 | S1 | Price | R1 | R2 | R3 | |
|---|---|---|---|---|---|---|---|
| ProTrendLines | 2,832.65 | 2,883.61 | 2,900.45 | 2,903.79 | 2,921.10 | 2,930.40 | 2,950.03 |
| Change (%) | -2.45% | -0.69% | -0.12% | - | +0.60% | +0.92% | +1.59% |
| Change | -71.14 | -20.18 | -3.34 | - | +17.31 | +26.61 | +46.24 |
| Level | Intermediate | Major | Minor | - | Intermediate | Minor | Major |
Attention could also be paid to pivot points to set price objectives:
| Pivot points | S3 | S2 | S1 | PP | R1 | R2 | R3 |
|---|---|---|---|---|---|---|---|
| Standard | 2,842.22 | 2,862.08 | 2,888.20 | 2,908.06 | 2,934.18 | 2,954.04 | 2,980.16 |
| Camarilla | 2,901.69 | 2,905.90 | 2,910.12 | 2,914.33 | 2,918.55 | 2,922.76 | 2,926.98 |
| Woodie | 2,845.36 | 2,863.65 | 2,891.34 | 2,909.63 | 2,937.32 | 2,955.61 | 2,983.30 |
| Fibonacci | 2,862.08 | 2,879.64 | 2,890.49 | 2,908.06 | 2,925.62 | 2,936.47 | 2,954.04 |
| Pivot points | S3 | S2 | S1 | PP | R1 | R2 | R3 |
|---|---|---|---|---|---|---|---|
| Standard | 2,683.99 | 2,758.32 | 2,807.58 | 2,881.91 | 2,931.17 | 3,005.50 | 3,054.76 |
| Camarilla | 2,822.85 | 2,834.18 | 2,845.51 | 2,856.84 | 2,868.17 | 2,879.50 | 2,890.83 |
| Woodie | 2,671.46 | 2,752.05 | 2,795.05 | 2,875.64 | 2,918.64 | 2,999.23 | 3,042.23 |
| Fibonacci | 2,758.32 | 2,805.53 | 2,834.70 | 2,881.91 | 2,929.12 | 2,958.29 | 3,005.50 |
| Pivot points | S3 | S2 | S1 | PP | R1 | R2 | R3 |
|---|---|---|---|---|---|---|---|
| Standard | 2,583.31 | 2,677.77 | 2,767.31 | 2,861.77 | 2,951.31 | 3,045.77 | 3,135.31 |
| Camarilla | 2,806.24 | 2,823.11 | 2,839.97 | 2,856.84 | 2,873.71 | 2,890.57 | 2,907.44 |
| Woodie | 2,580.84 | 2,676.54 | 2,764.84 | 2,860.54 | 2,948.84 | 3,044.54 | 3,132.84 |
| Fibonacci | 2,677.77 | 2,748.06 | 2,791.49 | 2,861.77 | 2,932.06 | 2,975.49 | 3,045.77 |
Numerical data
The following is the status of the technical indicators and moving averages at the time of publication of this technical analysis:
| RSI (14): | 36.23 | |
| MACD (12,26,9): | -2.7300 | |
| Directional Movement: | -22.10 | |
| AROON (14): | -42.86 | |
| DEMA (21): | 2,908.97 | |
| Parabolic SAR (0,02-0,02-0,2): | 2,917.89 | |
| Elder Ray (13): | -7.07 | |
| Super Trend (3,10): | 2,916.25 | |
| Zig ZAG (10): | 2,904.16 | |
| VORTEX (21): | 0.8200 | |
| Stochastique (14,3,5): | 21.34 | |
| TEMA (21): | 2,905.81 | |
| Williams %R (14): | -69.82 | |
| Chande Momentum Oscillator (20): | -12.12 | |
| Repulse (5,40,3): | -0.1600 | |
| ROCnROLL: | 2 | |
| TRIX (15,9): | -0.0100 | |
| Courbe Coppock: | 0.70 |
| MA7: | 2,897.08 | |
| MA20: | 2,906.48 | |
| MA50: | 2,788.29 | |
| MA100: | 2,728.66 | |
| MAexp7: | 2,905.95 | |
| MAexp20: | 2,911.80 | |
| MAexp50: | 2,913.52 | |
| MAexp100: | 2,911.12 | |
| Price / MA7: | +0.23% | |
| Price / MA20: | -0.09% | |
| Price / MA50: | +4.14% | |
| Price / MA100: | +6.42% | |
| Price / MAexp7: | -0.08% | |
| Price / MAexp20: | -0.28% | |
| Price / MAexp50: | -0.33% | |
| Price / MAexp100: | -0.25% |
News
The last news published on GOLD - USD at the time of the generation of this analysis was as follows:
-
 XAU/USD Price Forecast Today, Technical Analysis (March 05): Gold Bounces After Initial Pullback
-
Technical Outlook on EURUSD, USDJPY, Gold
-
XAU/USD Price Forecast Today, Technical Analysis (March 04): Gold Continues to Power Higher
-
XAU/USD Price Forecast Today, Technical Analysis (March 03): Gold Rallies to Kick Off the Week
-
XAU/USD Price Forecast Today, Technical Analysis (February 28): Gold Drops to New Low
About author

Online


Add a comment
Comments
0 comments on the analysis GOLD - USD - 15 min.