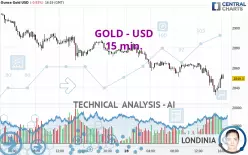
GOLD - USD - 15 min. - Technical analysis published on 02/28/2025 (GMT)
- 74
- 0
Click here for a new analysis!
- Timeframe : 15 min.
- - Analysis generated on
- Status : LEVEL MAINTAINED

Summary of the analysis

Additional analysis
Quotes
The GOLD - USD price is 2,849.29 USD. On the day, this instrument lost -0.93% and was traded between 2,832.65 USD and 2,885.11 USD over the period. The price is currently at +0.59% from its lowest and -1.24% from its highest.The Central Gaps scanner detects a bullish opening. A small advantage for buyers in the very short term.
Bullish opening
Type : Bullish
Timeframe : Openning
Here is a more detailed summary of the historical variations registered by GOLD - USD:
New HIGH record (5 years)
Type : Bullish
Timeframe : Weekly
Near a new HIGH record (1 year)
Type : Bullish
Timeframe : Weekly
Near a new HIGH record (1st january)
Type : Bullish
Timeframe : Weekly
Near a new HIGH record (1 month)
Type : Bullish
Timeframe : Weekly
Technical
A technical analysis in 15 min. of this GOLD - USD chart shows a sharp bearish trend. 92.86% of the signals given by moving averages are bearish. This strongly bearish trend is supported by the strong bearish signals given by short-term moving averages. An assessment of moving averages reveals a bullish signal that could impact this trend:
Bullish trend reversal : adaptative moving average 20
Type : Bullish
Timeframe : 15 minutes
An assessment of technical indicators does not currently provide any relevant information to suggest whether the signal given by the technical indicators is more bullish or bearish.
Caution: the Central Indicators scanner currently detects an excess:
Previous candle closed under Bollinger bands
Type : Neutral
Timeframe : 15 minutes
Pivot points : price is under support 1
Type : Neutral
Timeframe : 15 minutes
Pivot points : price is under support 1
Type : Neutral
Timeframe : Weekly
Parabolic SAR indicator bullish reversal
Type : Bullish
Timeframe : 15 minutes
Central Patterns, the scanner specializing in chart patterns, did not identify any signals.
The Central Candlesticks scanner, specialised in Japanese candlesticks, did not identify any signals.
| S3 | S2 | S1 | Price | R1 | R2 | R3 | |
|---|---|---|---|---|---|---|---|
| ProTrendLines | 2,588.23 | 2,720.21 | 2,785.43 | 2,849.29 | 2,867.84 | 2,877.18 | 2,888.30 |
| Change (%) | -9.16% | -4.53% | -2.24% | - | +0.65% | +0.98% | +1.37% |
| Change | -261.06 | -129.08 | -63.86 | - | +18.55 | +27.89 | +39.01 |
| Level | Intermediate | Intermediate | Minor | - | Major | Minor | Minor |
Attention could also be paid to pivot points to set price objectives:
| Pivot points | S3 | S2 | S1 | PP | R1 | R2 | R3 |
|---|---|---|---|---|---|---|---|
| Standard | 2,804.69 | 2,836.26 | 2,856.15 | 2,887.72 | 2,907.61 | 2,939.18 | 2,959.07 |
| Camarilla | 2,861.88 | 2,866.60 | 2,871.31 | 2,876.03 | 2,880.75 | 2,885.46 | 2,890.18 |
| Woodie | 2,798.84 | 2,833.34 | 2,850.30 | 2,884.80 | 2,901.76 | 2,936.26 | 2,953.22 |
| Fibonacci | 2,836.26 | 2,855.92 | 2,868.07 | 2,887.72 | 2,907.38 | 2,919.53 | 2,939.18 |
| Pivot points | S3 | S2 | S1 | PP | R1 | R2 | R3 |
|---|---|---|---|---|---|---|---|
| Standard | 2,815.13 | 2,846.83 | 2,891.55 | 2,923.25 | 2,967.97 | 2,999.67 | 3,044.39 |
| Camarilla | 2,915.26 | 2,922.26 | 2,929.27 | 2,936.27 | 2,943.28 | 2,950.28 | 2,957.29 |
| Woodie | 2,821.64 | 2,850.09 | 2,898.06 | 2,926.51 | 2,974.48 | 3,002.93 | 3,050.90 |
| Fibonacci | 2,846.83 | 2,876.02 | 2,894.06 | 2,923.25 | 2,952.44 | 2,970.48 | 2,999.67 |
| Pivot points | S3 | S2 | S1 | PP | R1 | R2 | R3 |
|---|---|---|---|---|---|---|---|
| Standard | 2,469.07 | 2,541.90 | 2,671.55 | 2,744.38 | 2,874.03 | 2,946.86 | 3,076.51 |
| Camarilla | 2,745.53 | 2,764.09 | 2,782.65 | 2,801.21 | 2,819.77 | 2,838.33 | 2,856.89 |
| Woodie | 2,497.49 | 2,556.11 | 2,699.97 | 2,758.59 | 2,902.45 | 2,961.07 | 3,104.93 |
| Fibonacci | 2,541.90 | 2,619.24 | 2,667.03 | 2,744.38 | 2,821.72 | 2,869.51 | 2,946.86 |
Numerical data
The following are the details of the technical indicators and moving averages that were collected to generate this technical analysis:
| RSI (14): | 37.91 | |
| MACD (12,26,9): | -5.7600 | |
| Directional Movement: | -17.76 | |
| AROON (14): | -78.57 | |
| DEMA (21): | 2,842.37 | |
| Parabolic SAR (0,02-0,02-0,2): | 2,832.90 | |
| Elder Ray (13): | -4.33 | |
| Super Trend (3,10): | 2,854.50 | |
| Zig ZAG (10): | 2,844.55 | |
| VORTEX (21): | 0.8200 | |
| Stochastique (14,3,5): | 32.76 | |
| TEMA (21): | 2,839.85 | |
| Williams %R (14): | -60.93 | |
| Chande Momentum Oscillator (20): | -11.83 | |
| Repulse (5,40,3): | 0.1600 | |
| ROCnROLL: | 2 | |
| TRIX (15,9): | -0.0200 | |
| Courbe Coppock: | 1.35 |
| MA7: | 2,911.09 | |
| MA20: | 2,896.39 | |
| MA50: | 2,770.30 | |
| MA100: | 2,720.79 | |
| MAexp7: | 2,843.32 | |
| MAexp20: | 2,849.37 | |
| MAexp50: | 2,857.61 | |
| MAexp100: | 2,867.06 | |
| Price / MA7: | -2.12% | |
| Price / MA20: | -1.63% | |
| Price / MA50: | +2.85% | |
| Price / MA100: | +4.72% | |
| Price / MAexp7: | +0.21% | |
| Price / MAexp20: | +0.00% | |
| Price / MAexp50: | -0.29% | |
| Price / MAexp100: | -0.62% |
News
Don't forget to follow the news on GOLD - USD. At the time of publication of this analysis, the latest news was as follows:
-
 XAU/USD Weekly Forecast, Technical Analysis (Mar 03 - 07): Gold Has a Horrible Week
-
XAU/USD Price Forecast Today, Technical Analysis (February 28): Gold Fell Pretty Significantly
-
XAU/USD Price Forecast Today, Technical Analysis (February 27): Gold Triggered a Bearish Reversal
-
XAU/USD Price Forecast Today, Technical Analysis (February 27): Gold Plunges Early on Thursday
-
Technical Analysis on BTCUSD, Gold, Oil
About author

Online


Add a comment
Comments
0 comments on the analysis GOLD - USD - 15 min.