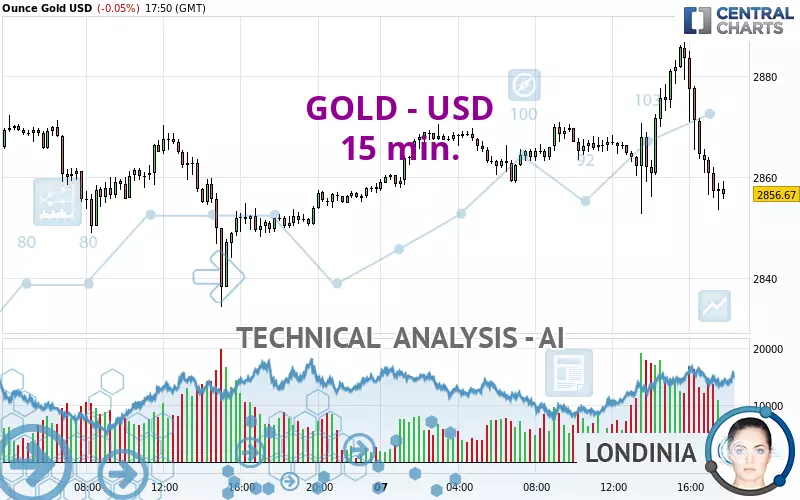
GOLD - USD - 15 min. - Technical analysis published on 02/07/2025 (GMT)
- 61
- 0
- Timeframe : 15 min.
- - Analysis generated on
- Status : IN PROGRESS...

Summary of the analysis

Additional analysis
Quotes
The GOLD - USD price is 2,856.76 USD. The price registered a decrease of -0.04% on the session and was between 2,852.61 USD and 2,886.80 USD. This implies that the price is at +0.15% from its lowest and at -1.04% from its highest.The Central Gaps scanner detects a bullish opening. A small advantage for buyers in the very short term.
Bullish opening
Type : Bullish
Timeframe : Openning
A study of price movements over other periods shows the following variations:
New HIGH record (5 years)
Type : Bullish
Timeframe : Weekly
New HIGH record (1 year)
Type : Bullish
Timeframe : Weekly
New HIGH record (1st january)
Type : Bullish
Timeframe : Weekly
New HIGH record (1 month)
Type : Bullish
Timeframe : Weekly
Technical
A technical analysis in 15 min. of this GOLD - USD chart shows a bearish trend. The signals given by moving averages are 64.29% bearish. This bearish trend is reinforced by the strong signals currently being given by short-term moving averages. There is no crossing of moving average by the price or crossing of moving averages between themselves.
In fact, Central Analyzer took into account 18 technical indicators and the result was as follows: 4 are bullish, 4 are neutral and 10 are bearish. Caution: the Central Indicators scanner currently detects an excess:
Williams %R indicator is oversold : under -80
Type : Neutral
Timeframe : 15 minutes
Pivot points : price is over resistance 1
Type : Neutral
Timeframe : Weekly
No signals are given by Central Patterns, a market scanner specialised in chart patterns, resistances and supports.
Central Candlesticks, the scanner specialised in Japanese candlesticks, detects these signals that could have an impact on the current short-term trend:
Black hanging man / hammer
Type : Neutral
Timeframe : 15 minutes
Bearish engulfing lines
Type : Bearish
Timeframe : 15 minutes
| S3 | S2 | S1 | Price | R1 | R2 | |
|---|---|---|---|---|---|---|
| ProTrendLines | 2,785.43 | 2,807.22 | 2,834.23 | 2,856.76 | 2,870.30 | 2,882.50 |
| Change (%) | -2.50% | -1.73% | -0.79% | - | +0.47% | +0.90% |
| Change | -71.33 | -49.54 | -22.53 | - | +13.54 | +25.74 |
| Level | Minor | Minor | Minor | - | Minor | Intermediate |
To determine price objectives, it is also possible to use the pivot points. Here is the price position in relation to pivot points:
| Pivot points | S3 | S2 | S1 | PP | R1 | R2 | R3 |
|---|---|---|---|---|---|---|---|
| Standard | 2,797.88 | 2,816.06 | 2,837.03 | 2,855.21 | 2,876.18 | 2,894.36 | 2,915.33 |
| Camarilla | 2,847.24 | 2,850.83 | 2,854.42 | 2,858.01 | 2,861.60 | 2,865.19 | 2,868.78 |
| Woodie | 2,799.29 | 2,816.76 | 2,838.44 | 2,855.91 | 2,877.59 | 2,895.06 | 2,916.74 |
| Fibonacci | 2,816.06 | 2,831.01 | 2,840.25 | 2,855.21 | 2,870.16 | 2,879.40 | 2,894.36 |
| Pivot points | S3 | S2 | S1 | PP | R1 | R2 | R3 |
|---|---|---|---|---|---|---|---|
| Standard | 2,662.12 | 2,696.34 | 2,748.77 | 2,782.99 | 2,835.42 | 2,869.64 | 2,922.07 |
| Camarilla | 2,777.38 | 2,785.32 | 2,793.27 | 2,801.21 | 2,809.15 | 2,817.10 | 2,825.04 |
| Woodie | 2,671.24 | 2,700.89 | 2,757.89 | 2,787.54 | 2,844.54 | 2,874.19 | 2,931.19 |
| Fibonacci | 2,696.34 | 2,729.44 | 2,749.89 | 2,782.99 | 2,816.09 | 2,836.54 | 2,869.64 |
| Pivot points | S3 | S2 | S1 | PP | R1 | R2 | R3 |
|---|---|---|---|---|---|---|---|
| Standard | 2,469.07 | 2,541.90 | 2,671.55 | 2,744.38 | 2,874.03 | 2,946.86 | 3,076.51 |
| Camarilla | 2,745.53 | 2,764.09 | 2,782.65 | 2,801.21 | 2,819.77 | 2,838.33 | 2,856.89 |
| Woodie | 2,497.49 | 2,556.11 | 2,699.97 | 2,758.59 | 2,902.45 | 2,961.07 | 3,104.93 |
| Fibonacci | 2,541.90 | 2,619.24 | 2,667.03 | 2,744.38 | 2,821.72 | 2,869.51 | 2,946.86 |
Numerical data
The following is the status of technical indicators and moving averages registered at the time this technical analysis was created:
| RSI (14): | 35.61 | |
| MACD (12,26,9): | -2.1600 | |
| Directional Movement: | -20.02 | |
| AROON (14): | -50.00 | |
| DEMA (21): | 2,864.54 | |
| Parabolic SAR (0,02-0,02-0,2): | 2,876.00 | |
| Elder Ray (13): | -6.85 | |
| Super Trend (3,10): | 2,874.59 | |
| Zig ZAG (10): | 2,857.72 | |
| VORTEX (21): | 0.9500 | |
| Stochastique (14,3,5): | 11.44 | |
| TEMA (21): | 2,861.22 | |
| Williams %R (14): | -88.74 | |
| Chande Momentum Oscillator (20): | -19.42 | |
| Repulse (5,40,3): | -0.1100 | |
| ROCnROLL: | 2 | |
| TRIX (15,9): | 0.0000 | |
| Courbe Coppock: | 0.48 |
| MA7: | 2,833.82 | |
| MA20: | 2,764.58 | |
| MA50: | 2,692.32 | |
| MA100: | 2,680.13 | |
| MAexp7: | 2,861.55 | |
| MAexp20: | 2,866.29 | |
| MAexp50: | 2,866.38 | |
| MAexp100: | 2,864.70 | |
| Price / MA7: | +0.81% | |
| Price / MA20: | +3.33% | |
| Price / MA50: | +6.11% | |
| Price / MA100: | +6.59% | |
| Price / MAexp7: | -0.17% | |
| Price / MAexp20: | -0.33% | |
| Price / MAexp50: | -0.34% | |
| Price / MAexp100: | -0.28% |
News
The last news published on GOLD - USD at the time of the generation of this analysis was as follows:
-
 XAU/USD Price Forecast Today, Technical Analysis (February 07): Gold Rallies Again for the Week
-
XAU/USD Price Forecast Today, Technical Analysis (February 06): Gold Retreats After Record High
-
Gold (XAU/USD) Daily Price Forecast and Technical Analysis, February 6, 2025, #trading #gold #xau
-
XAU/USD Price Forecast Today, Technical Analysis (February 06): Gold Continues to Look Bullish
-
Technical Analysis on Gold, Oil, USDJPY
About author

Online


Add a comment
Comments
0 comments on the analysis GOLD - USD - 15 min.