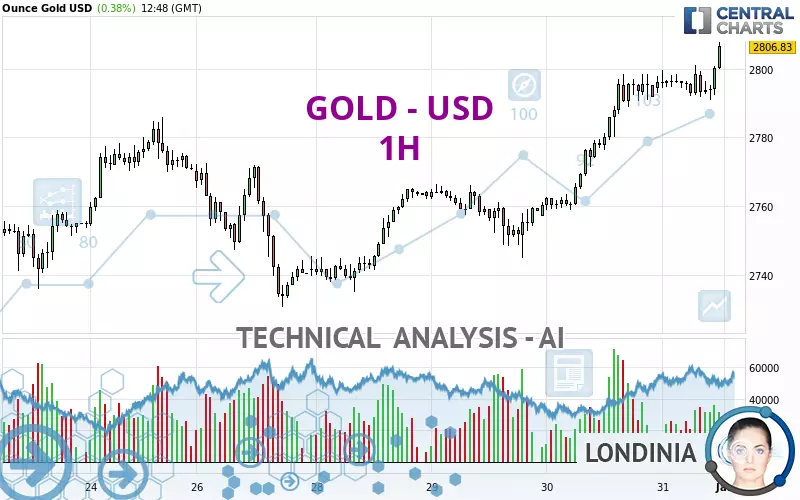
GOLD - USD - 1H - Technical analysis published on 01/31/2025 (GMT)
- 128
- 0
Click here for a new analysis!
- Timeframe : 1H
- - Analysis generated on
- Status : INVALID

Summary of the analysis

Additional analysis
Quotes
The GOLD - USD rating is 2,806.82 USD. The price has increased by +0.38% since the last closing with the lowest point at 2,791.03 USD and the highest point at 2,807.86 USD. The deviation from the price is +0.57% for the low point and -0.04% for the high point.The Central Gaps scanner detects a bullish opening. A small advantage for buyers in the very short term.
Bullish opening
Type : Bullish
Timeframe : Openning
A study of price movements over other periods shows the following variations:
New HIGH record (5 years)
Type : Bullish
Timeframe : Weekly
New HIGH record (1 year)
Type : Bullish
Timeframe : Weekly
New HIGH record (1st january)
Type : Bullish
Timeframe : Weekly
New HIGH record (1 month)
Type : Bullish
Timeframe : Weekly
Technical
Technical analysis of this 1H chart of GOLD - USD indicates that the overall trend is strongly bullish. 92.86% of the signals given by moving averages are bullish. The overall trend is supported by the strong bullish signals from short-term moving averages. There is no crossing of moving average by the price or crossing of moving averages between themselves.
An assessment of technical indicators shows a strong bullish signal.
Caution: the Central Indicators scanner currently detects an excess:
RSI indicator is overbought : over 70
Type : Neutral
Timeframe : 1 hour
CCI indicator is overbought : over 100
Type : Neutral
Timeframe : 1 hour
Williams %R indicator is overbought : over -20
Type : Neutral
Timeframe : 1 hour
The analysis of the price chart with Central Patterns scanners does not return any result.
The Central Candlesticks scanner which studies Japanese candlesticks did not detect anything.
| S3 | S2 | S1 | Price | |
|---|---|---|---|---|
| ProTrendLines | 2,766.22 | 2,785.43 | 2,798.61 | 2,806.82 |
| Change (%) | -1.45% | -0.76% | -0.29% | - |
| Change | -40.60 | -21.39 | -8.21 | - |
| Level | Intermediate | Major | Intermediate | - |
Attention could also be paid to pivot points to set price objectives:
| Pivot points | S3 | S2 | S1 | PP | R1 | R2 | R3 |
|---|---|---|---|---|---|---|---|
| Standard | 2,730.69 | 2,744.75 | 2,770.50 | 2,784.56 | 2,810.31 | 2,824.37 | 2,850.12 |
| Camarilla | 2,785.31 | 2,788.96 | 2,792.61 | 2,796.26 | 2,799.91 | 2,803.56 | 2,807.21 |
| Woodie | 2,736.55 | 2,747.67 | 2,776.36 | 2,787.48 | 2,816.17 | 2,827.29 | 2,855.98 |
| Fibonacci | 2,744.75 | 2,759.95 | 2,769.35 | 2,784.56 | 2,799.76 | 2,809.16 | 2,824.37 |
| Pivot points | S3 | S2 | S1 | PP | R1 | R2 | R3 |
|---|---|---|---|---|---|---|---|
| Standard | 2,614.84 | 2,652.12 | 2,711.40 | 2,748.68 | 2,807.96 | 2,845.24 | 2,904.52 |
| Camarilla | 2,744.14 | 2,752.99 | 2,761.84 | 2,770.69 | 2,779.54 | 2,788.39 | 2,797.24 |
| Woodie | 2,625.85 | 2,657.62 | 2,722.41 | 2,754.18 | 2,818.97 | 2,850.74 | 2,915.53 |
| Fibonacci | 2,652.12 | 2,689.00 | 2,711.79 | 2,748.68 | 2,785.56 | 2,808.35 | 2,845.24 |
| Pivot points | S3 | S2 | S1 | PP | R1 | R2 | R3 |
|---|---|---|---|---|---|---|---|
| Standard | 2,419.40 | 2,501.32 | 2,562.46 | 2,644.38 | 2,705.52 | 2,787.44 | 2,848.58 |
| Camarilla | 2,584.26 | 2,597.37 | 2,610.49 | 2,623.60 | 2,636.71 | 2,649.83 | 2,662.94 |
| Woodie | 2,409.01 | 2,496.13 | 2,552.07 | 2,639.19 | 2,695.13 | 2,782.25 | 2,838.19 |
| Fibonacci | 2,501.32 | 2,555.97 | 2,589.73 | 2,644.38 | 2,699.03 | 2,732.79 | 2,787.44 |
Numerical data
The following is the status of technical indicators and moving averages registered at the time this technical analysis was created:
| RSI (14): | 72.54 | |
| MACD (12,26,9): | 5.6100 | |
| Directional Movement: | 25.66 | |
| AROON (14): | 14.29 | |
| DEMA (21): | 2,801.87 | |
| Parabolic SAR (0,02-0,02-0,2): | 2,791.03 | |
| Elder Ray (13): | 7.25 | |
| Super Trend (3,10): | 2,787.16 | |
| Zig ZAG (10): | 2,806.82 | |
| VORTEX (21): | 1.1000 | |
| Stochastique (14,3,5): | 73.03 | |
| TEMA (21): | 2,801.07 | |
| Williams %R (14): | -8.56 | |
| Chande Momentum Oscillator (20): | 10.51 | |
| Repulse (5,40,3): | 0.4600 | |
| ROCnROLL: | 1 | |
| TRIX (15,9): | 0.0300 | |
| Courbe Coppock: | 0.23 |
| MA7: | 2,770.33 | |
| MA20: | 2,718.19 | |
| MA50: | 2,672.93 | |
| MA100: | 2,666.33 | |
| MAexp7: | 2,798.56 | |
| MAexp20: | 2,793.94 | |
| MAexp50: | 2,782.65 | |
| MAexp100: | 2,771.62 | |
| Price / MA7: | +1.32% | |
| Price / MA20: | +3.26% | |
| Price / MA50: | +5.01% | |
| Price / MA100: | +5.27% | |
| Price / MAexp7: | +0.30% | |
| Price / MAexp20: | +0.46% | |
| Price / MAexp50: | +0.87% | |
| Price / MAexp100: | +1.27% |
News
Don't forget to follow the news on GOLD - USD. At the time of publication of this analysis, the latest news was as follows:
-
 Gold @ all time high and traders look towards $3,000 oz
-
XAU/USD Price Forecast Today, Technical Analysis (January 30): Gold Surged to a Record High
-
Gold (XAU/USD) Daily Price Forecast and Technical Analysis, January 30, 2025, #gold #xauusd #xau
-
XAU/USD Price Forecast Today, Technical Analysis (January 30): Gold Rallies Hard on Thursday
-
XAU/USD Price Forecast Today, Technical Analysis (January 29): Gold Tests Resistance
About author

Online


Add a comment
Comments
0 comments on the analysis GOLD - USD - 1H