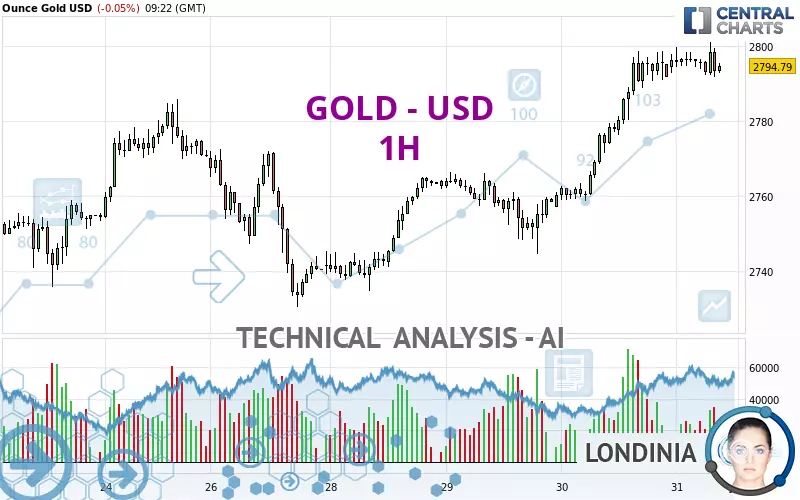
GOLD - USD - 1H - Technical analysis published on 01/31/2025 (GMT)
- 91
- 0
Click here for a new analysis!
- Timeframe : 1H
- - Analysis generated on
- Status : INVALID

Summary of the analysis

Additional analysis
Quotes
GOLD - USD rating 2,794.79 USD. On the day, this instrument lost -0.05% with the lowest point at 2,791.71 USD and the highest point at 2,801.05 USD. The deviation from the price is +0.11% for the low point and -0.22% for the high point.A bullish opening was detected by the Central Gaps scanner. Buyers are trying to impose a bullish momentum in the very short term.
Bullish opening
Type : Bullish
Timeframe : Openning
A study of price movements over other periods shows the following variations:
New HIGH record (5 years)
Type : Bullish
Timeframe : Weekly
New HIGH record (1 year)
Type : Bullish
Timeframe : Weekly
New HIGH record (1st january)
Type : Bullish
Timeframe : Weekly
New HIGH record (1 month)
Type : Bullish
Timeframe : Weekly
Technical
Technical analysis of this 1H chart of GOLD - USD indicates that the overall trend is strongly bullish. The signals given by the moving averages are 92.86% bullish. This strong bullish trend is confirmed by the strong signals currently being given by short-term moving averages. The Central Indicators scanner detects a bullish signal on moving averages that could impact this trend:
Bullish price crossover with adaptative moving average 20
Type : Bullish
Timeframe : 1 hour
In fact, of the 18 technical indicators analysed by Central Analyzer, 7 are bullish, 5 are neutral and 6 are bearish. No additional result has been identified by Central Indicators, the scanner specialised in technical indicators.
Central Patterns, the scanner specializing in chart patterns, did not identify any signals.
For a small setback in the very short term, the Central Candlesticks scanner currently notes the presence of this bearish pattern in Japanese candlesticks:
Bearish harami
Type : Bearish
Timeframe : 1 hour
| S3 | S2 | S1 | Price | R1 | |
|---|---|---|---|---|---|
| ProTrendLines | 2,744.94 | 2,766.22 | 2,785.43 | 2,794.79 | 2,798.61 |
| Change (%) | -1.78% | -1.02% | -0.33% | - | +0.14% |
| Change | -49.85 | -28.57 | -9.36 | - | +3.82 |
| Level | Intermediate | Intermediate | Major | - | Intermediate |
Attention could also be paid to pivot points to set price objectives:
| Pivot points | S3 | S2 | S1 | PP | R1 | R2 | R3 |
|---|---|---|---|---|---|---|---|
| Standard | 2,730.69 | 2,744.75 | 2,770.50 | 2,784.56 | 2,810.31 | 2,824.37 | 2,850.12 |
| Camarilla | 2,785.31 | 2,788.96 | 2,792.61 | 2,796.26 | 2,799.91 | 2,803.56 | 2,807.21 |
| Woodie | 2,736.55 | 2,747.67 | 2,776.36 | 2,787.48 | 2,816.17 | 2,827.29 | 2,855.98 |
| Fibonacci | 2,744.75 | 2,759.95 | 2,769.35 | 2,784.56 | 2,799.76 | 2,809.16 | 2,824.37 |
| Pivot points | S3 | S2 | S1 | PP | R1 | R2 | R3 |
|---|---|---|---|---|---|---|---|
| Standard | 2,614.84 | 2,652.12 | 2,711.40 | 2,748.68 | 2,807.96 | 2,845.24 | 2,904.52 |
| Camarilla | 2,744.14 | 2,752.99 | 2,761.84 | 2,770.69 | 2,779.54 | 2,788.39 | 2,797.24 |
| Woodie | 2,625.85 | 2,657.62 | 2,722.41 | 2,754.18 | 2,818.97 | 2,850.74 | 2,915.53 |
| Fibonacci | 2,652.12 | 2,689.00 | 2,711.79 | 2,748.68 | 2,785.56 | 2,808.35 | 2,845.24 |
| Pivot points | S3 | S2 | S1 | PP | R1 | R2 | R3 |
|---|---|---|---|---|---|---|---|
| Standard | 2,419.40 | 2,501.32 | 2,562.46 | 2,644.38 | 2,705.52 | 2,787.44 | 2,848.58 |
| Camarilla | 2,584.26 | 2,597.37 | 2,610.49 | 2,623.60 | 2,636.71 | 2,649.83 | 2,662.94 |
| Woodie | 2,409.01 | 2,496.13 | 2,552.07 | 2,639.19 | 2,695.13 | 2,782.25 | 2,838.19 |
| Fibonacci | 2,501.32 | 2,555.97 | 2,589.73 | 2,644.38 | 2,699.03 | 2,732.79 | 2,787.44 |
Numerical data
The following is the status of the technical indicators and moving averages at the time of publication of this technical analysis:
| RSI (14): | 59.01 | |
| MACD (12,26,9): | 5.8000 | |
| Directional Movement: | 17.84 | |
| AROON (14): | 85.72 | |
| DEMA (21): | 2,799.80 | |
| Parabolic SAR (0,02-0,02-0,2): | 2,792.20 | |
| Elder Ray (13): | 1.97 | |
| Super Trend (3,10): | 2,782.03 | |
| Zig ZAG (10): | 2,793.33 | |
| VORTEX (21): | 1.1200 | |
| Stochastique (14,3,5): | 46.52 | |
| TEMA (21): | 2,799.14 | |
| Williams %R (14): | -73.39 | |
| Chande Momentum Oscillator (20): | -2.08 | |
| Repulse (5,40,3): | -0.1400 | |
| ROCnROLL: | -1 | |
| TRIX (15,9): | 0.0400 | |
| Courbe Coppock: | 0.26 |
| MA7: | 2,768.61 | |
| MA20: | 2,717.48 | |
| MA50: | 2,672.66 | |
| MA100: | 2,666.19 | |
| MAexp7: | 2,795.33 | |
| MAexp20: | 2,791.24 | |
| MAexp50: | 2,779.82 | |
| MAexp100: | 2,769.39 | |
| Price / MA7: | +0.95% | |
| Price / MA20: | +2.84% | |
| Price / MA50: | +4.57% | |
| Price / MA100: | +4.82% | |
| Price / MAexp7: | -0.02% | |
| Price / MAexp20: | +0.13% | |
| Price / MAexp50: | +0.54% | |
| Price / MAexp100: | +0.92% |
News
The latest news and videos published on GOLD - USD at the time of the analysis were as follows:
-
 Gold @ all time high and traders look towards $3,000 oz
-
XAU/USD Price Forecast Today, Technical Analysis (January 30): Gold Surged to a Record High
-
Gold (XAU/USD) Daily Price Forecast and Technical Analysis, January 30, 2025, #gold #xauusd #xau
-
XAU/USD Price Forecast Today, Technical Analysis (January 30): Gold Rallies Hard on Thursday
-
XAU/USD Price Forecast Today, Technical Analysis (January 29): Gold Tests Resistance
About author

Online


Add a comment
Comments
0 comments on the analysis GOLD - USD - 1H