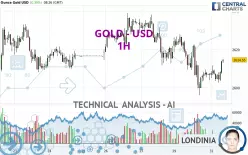
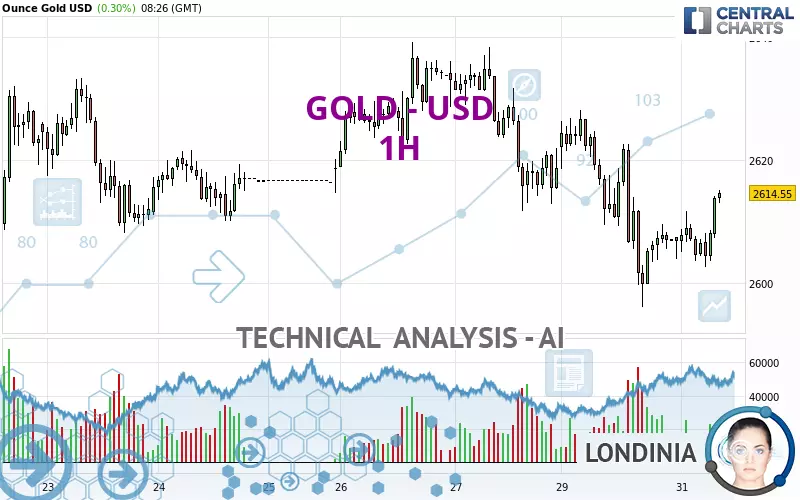
GOLD - USD - 1H - Technical analysis published on 12/31/2024 (GMT)
- 138
- 0
- Who voted?
Click here for a new analysis!
- Timeframe : 1H
- - Analysis generated on
- Status : INVALID
Summary of the analysis

Additional analysis
Quotes
The GOLD - USD rating is 2,614.59 USD. The price has increased by +0.30% since the last closing and was between 2,602.66 USD and 2,615.10 USD. This implies that the price is at +0.46% from its lowest and at -0.02% from its highest.Here is a more detailed summary of the historical variations registered by GOLD - USD:
Near a new HIGH record (1 month)
Type : Bullish
Timeframe : Weekly
Technical
Technical analysis of GOLD - USD in 1H shows an overall bearish trend. 71.43% of the signals given by moving averages are bearish. Caution: the slightly bullish signals currently given by short-term moving averages show a possible weakening of the global trend. The Central Indicators scanner detects a bullish signal on moving averages that could impact this trend:
Bullish trend reversal : adaptative moving average 20
Type : Bullish
Timeframe : 1 hour
The technical indicators are bullish. There is still some doubt about the price increase.
But beware of excesses. The Central Indicators scanner currently detects this:
CCI indicator is overbought : over 100
Type : Neutral
Timeframe : 1 hour
Previous candle closed over Bollinger bands
Type : Neutral
Timeframe : 1 hour
Williams %R indicator is overbought : over -20
Type : Neutral
Timeframe : 1 hour
Price is back under the pivot point
Type : Bearish
Timeframe : Weekly
Central Patterns, the scanner specializing in chart patterns, did not identify any signals.
The presence of these Japanese chandelier patterns detected by Central Candlesticks that could impact the current short-term trend were also noted:
Black gravestone / inverted hammer
Type : Bearish
Timeframe : 1 hour
Bearish harami
Type : Bearish
Timeframe : 1 hour
Bearish harami cross
Type : Bearish
Timeframe : 1 hour
Three white soldiers
Type : Bullish
Timeframe : 1 hour
| S3 | S2 | S1 | Price | R1 | R2 | R3 | |
|---|---|---|---|---|---|---|---|
| ProTrendLines | 2,596.10 | 2,603.69 | 2,608.88 | 2,614.59 | 2,621.67 | 2,633.36 | 2,638.91 |
| Change (%) | -0.71% | -0.42% | -0.22% | - | +0.27% | +0.72% | +0.93% |
| Change | -18.49 | -10.90 | -5.71 | - | +7.08 | +18.77 | +24.32 |
| Level | Major | Minor | Intermediate | - | Minor | Minor | Intermediate |
To determine price objectives, it is also possible to use the pivot points. Here is the price position in relation to pivot points:
| Pivot points | S3 | S2 | S1 | PP | R1 | R2 | R3 |
|---|---|---|---|---|---|---|---|
| Standard | 2,560.49 | 2,578.29 | 2,592.57 | 2,610.37 | 2,624.65 | 2,642.45 | 2,656.73 |
| Camarilla | 2,598.02 | 2,600.96 | 2,603.90 | 2,606.84 | 2,609.78 | 2,612.72 | 2,615.66 |
| Woodie | 2,558.72 | 2,577.41 | 2,590.80 | 2,609.49 | 2,622.88 | 2,641.57 | 2,654.96 |
| Fibonacci | 2,578.29 | 2,590.55 | 2,598.12 | 2,610.37 | 2,622.63 | 2,630.20 | 2,642.45 |
| Pivot points | S3 | S2 | S1 | PP | R1 | R2 | R3 |
|---|---|---|---|---|---|---|---|
| Standard | 2,573.86 | 2,591.02 | 2,604.86 | 2,622.02 | 2,635.86 | 2,653.02 | 2,666.86 |
| Camarilla | 2,610.19 | 2,613.03 | 2,615.87 | 2,618.71 | 2,621.55 | 2,624.39 | 2,627.24 |
| Woodie | 2,572.21 | 2,590.19 | 2,603.21 | 2,621.19 | 2,634.21 | 2,652.19 | 2,665.21 |
| Fibonacci | 2,591.02 | 2,602.86 | 2,610.18 | 2,622.02 | 2,633.86 | 2,641.18 | 2,653.02 |
| Pivot points | S3 | S2 | S1 | PP | R1 | R2 | R3 |
|---|---|---|---|---|---|---|---|
| Standard | 2,311.93 | 2,424.40 | 2,537.33 | 2,649.80 | 2,762.73 | 2,875.20 | 2,988.13 |
| Camarilla | 2,588.28 | 2,608.94 | 2,629.60 | 2,650.26 | 2,670.92 | 2,691.58 | 2,712.25 |
| Woodie | 2,312.16 | 2,424.52 | 2,537.56 | 2,649.92 | 2,762.96 | 2,875.32 | 2,988.36 |
| Fibonacci | 2,424.40 | 2,510.50 | 2,563.70 | 2,649.80 | 2,735.90 | 2,789.10 | 2,875.20 |
Numerical data
The following is the status of the technical indicators and moving averages at the time of publication of this technical analysis:
| RSI (14): | 54.05 | |
| MACD (12,26,9): | -1.5300 | |
| Directional Movement: | -0.57 | |
| AROON (14): | 21.43 | |
| DEMA (21): | 2,606.88 | |
| Parabolic SAR (0,02-0,02-0,2): | 2,601.34 | |
| Elder Ray (13): | 4.91 | |
| Super Trend (3,10): | 2,619.53 | |
| Zig ZAG (10): | 2,614.46 | |
| VORTEX (21): | 1.0300 | |
| Stochastique (14,3,5): | 88.04 | |
| TEMA (21): | 2,608.68 | |
| Williams %R (14): | -1.38 | |
| Chande Momentum Oscillator (20): | 7.16 | |
| Repulse (5,40,3): | 0.3400 | |
| ROCnROLL: | -1 | |
| TRIX (15,9): | -0.0200 | |
| Courbe Coppock: | 0.19 |
| MA7: | 2,618.42 | |
| MA20: | 2,638.91 | |
| MA50: | 2,661.46 | |
| MA100: | 2,619.77 | |
| MAexp7: | 2,610.04 | |
| MAexp20: | 2,609.59 | |
| MAexp50: | 2,614.05 | |
| MAexp100: | 2,617.81 | |
| Price / MA7: | -0.15% | |
| Price / MA20: | -0.92% | |
| Price / MA50: | -1.76% | |
| Price / MA100: | -0.20% | |
| Price / MAexp7: | +0.17% | |
| Price / MAexp20: | +0.19% | |
| Price / MAexp50: | +0.02% | |
| Price / MAexp100: | -0.12% |
News
Don't forget to follow the news on GOLD - USD. At the time of publication of this analysis, the latest news was as follows:
-
 XAU/USD Price Forecast Today, Technical Analysis (December 30): Gold a Bit Choppy on Monday
-
XAU/USD Price Forecast Today, Technical Analysis (December 27): Gold Battles Resistance
-
XAU/USD Weekly Forecast, Technical Analysis (Dec 30 - Jan 3): Gold Has a Tough Week
-
XAU/USD Price Forecast Today, Technical Analysis (December 27): Gold Falls Again on Friday
-
XAU/USD Price Forecast Today, Technical Analysis (December 26): Gold Advances to a Five-day High
About author

Online


Add a comment
Comments
0 comments on the analysis GOLD - USD - 1H