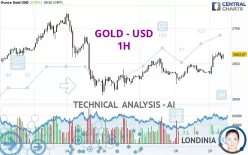
GOLD - USD - 1H - Technical analysis published on 11/29/2024 (GMT)
- 216
- 0
Click here for a new analysis!
- Timeframe : 1H
- - Analysis generated on
- Status : INVALID

Summary of the analysis

Additional analysis
Quotes
The GOLD - USD price is 2,663.07 USD. On the day, this instrument gained +0.92% with the lowest point at 2,634.07 USD and the highest point at 2,666.40 USD. The deviation from the price is +1.10% for the low point and -0.12% for the high point.The Central Gaps scanner detects a bullish opening. A small advantage for buyers in the very short term.
Bullish opening
Type : Bullish
Timeframe : Openning
A study of price movements over other periods shows the following variations:
Near a new HIGH record (5 years)
Type : Bullish
Timeframe : Weekly
Near a new HIGH record (1 year)
Type : Bullish
Timeframe : Weekly
Near a new HIGH record (1st january)
Type : Bullish
Timeframe : Weekly
Near a new HIGH record (1 month)
Type : Bullish
Timeframe : Weekly
Technical
A technical analysis in 1H of this GOLD - USD chart shows a strongly bullish trend. 82.14% of the signals given by moving averages are bullish. The overall trend is supported by the strong bullish signals from short-term moving averages. The Central Indicators market scanner currently does not detect any result that concerns moving averages.
The probability of a further increase is high given the direction of the technical indicators.
Caution: the Central Indicators scanner currently detects an excess:
Williams %R indicator is overbought : over -20
Type : Neutral
Timeframe : 1 hour
Pivot points : price is over resistance 1
Type : Neutral
Timeframe : 1 hour
Price is back under the pivot point
Type : Bearish
Timeframe : Weekly
No signals are given by Central Patterns, a market scanner specialised in chart patterns, resistances and supports.
The presence of a bullish Japanese candlestick pattern detected by Central Candlesticks that could cause a very short term rebound was also detected:
Bullish harami
Type : Bullish
Timeframe : 1 hour
| S3 | S2 | S1 | Price | R1 | R2 | R3 | |
|---|---|---|---|---|---|---|---|
| ProTrendLines | 2,621.00 | 2,632.26 | 2,658.29 | 2,663.07 | 2,672.68 | 2,688.78 | 2,721.34 |
| Change (%) | -1.58% | -1.16% | -0.18% | - | +0.36% | +0.97% | +2.19% |
| Change | -42.07 | -30.81 | -4.78 | - | +9.61 | +25.71 | +58.27 |
| Level | Intermediate | Minor | Major | - | Intermediate | Minor | Intermediate |
To determine price objectives, it is also possible to use the pivot points. Here is the price position in relation to pivot points:
| Pivot points | S3 | S2 | S1 | PP | R1 | R2 | R3 |
|---|---|---|---|---|---|---|---|
| Standard | 2,594.53 | 2,607.75 | 2,623.28 | 2,636.50 | 2,652.03 | 2,665.25 | 2,680.78 |
| Camarilla | 2,630.90 | 2,633.54 | 2,636.18 | 2,638.81 | 2,641.45 | 2,644.08 | 2,646.72 |
| Woodie | 2,595.69 | 2,608.33 | 2,624.44 | 2,637.08 | 2,653.19 | 2,665.83 | 2,681.94 |
| Fibonacci | 2,607.75 | 2,618.73 | 2,625.52 | 2,636.50 | 2,647.48 | 2,654.27 | 2,665.25 |
| Pivot points | S3 | S2 | S1 | PP | R1 | R2 | R3 |
|---|---|---|---|---|---|---|---|
| Standard | 2,459.22 | 2,510.78 | 2,613.30 | 2,664.86 | 2,767.38 | 2,818.94 | 2,921.46 |
| Camarilla | 2,673.45 | 2,687.57 | 2,701.70 | 2,715.82 | 2,729.94 | 2,744.07 | 2,758.19 |
| Woodie | 2,484.70 | 2,523.52 | 2,638.78 | 2,677.60 | 2,792.86 | 2,831.68 | 2,946.94 |
| Fibonacci | 2,510.78 | 2,569.64 | 2,606.00 | 2,664.86 | 2,723.72 | 2,760.08 | 2,818.94 |
| Pivot points | S3 | S2 | S1 | PP | R1 | R2 | R3 |
|---|---|---|---|---|---|---|---|
| Standard | 2,449.76 | 2,526.52 | 2,636.63 | 2,713.39 | 2,823.50 | 2,900.26 | 3,010.37 |
| Camarilla | 2,695.36 | 2,712.49 | 2,729.62 | 2,746.75 | 2,763.88 | 2,781.01 | 2,798.14 |
| Woodie | 2,466.45 | 2,534.86 | 2,653.32 | 2,721.73 | 2,840.19 | 2,908.60 | 3,027.06 |
| Fibonacci | 2,526.52 | 2,597.90 | 2,642.00 | 2,713.39 | 2,784.77 | 2,828.87 | 2,900.26 |
Numerical data
The following is the status of the technical indicators and moving averages at the time of publication of this technical analysis:
| RSI (14): | 61.82 | |
| MACD (12,26,9): | 5.5700 | |
| Directional Movement: | 11.05 | |
| AROON (14): | 35.71 | |
| DEMA (21): | 2,657.64 | |
| Parabolic SAR (0,02-0,02-0,2): | 2,641.96 | |
| Elder Ray (13): | 4.78 | |
| Super Trend (3,10): | 2,646.60 | |
| Zig ZAG (10): | 2,658.19 | |
| VORTEX (21): | 1.1000 | |
| Stochastique (14,3,5): | 77.02 | |
| TEMA (21): | 2,661.69 | |
| Williams %R (14): | -20.45 | |
| Chande Momentum Oscillator (20): | 22.80 | |
| Repulse (5,40,3): | 0.0500 | |
| ROCnROLL: | 1 | |
| TRIX (15,9): | 0.0200 | |
| Courbe Coppock: | 1.43 |
| MA7: | 2,652.07 | |
| MA20: | 2,646.17 | |
| MA50: | 2,669.69 | |
| MA100: | 2,573.43 | |
| MAexp7: | 2,658.45 | |
| MAexp20: | 2,651.04 | |
| MAexp50: | 2,645.70 | |
| MAexp100: | 2,644.50 | |
| Price / MA7: | +0.41% | |
| Price / MA20: | +0.64% | |
| Price / MA50: | -0.25% | |
| Price / MA100: | +3.48% | |
| Price / MAexp7: | +0.17% | |
| Price / MAexp20: | +0.45% | |
| Price / MAexp50: | +0.66% | |
| Price / MAexp100: | +0.70% |
News
The latest news and videos published on GOLD - USD at the time of the analysis were as follows:
-
 XAU/USD Price Forecast Today, Technical Analysis (November 28): Gold Finds Resistance Around MA
-
Gold Forecast November 29, 2024
-
XAU/USD Price Forecast Today, Technical Analysis (November 28): Gold Bounces Slightly
-
XAU/USD Price Forecast Today, Technical Analysis (November 27): Gold Triggered Weakness
-
Gold Daily Forecast and Technical Analysis, November 27, 2024, #FXEmpire #trading #gold #xauusd
About author

Online


Add a comment
Comments
0 comments on the analysis GOLD - USD - 1H