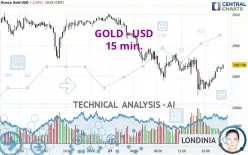
GOLD - USD - 15 min. - Technical analysis published on 02/27/2025 (GMT)
- 61
- 0
Click here for a new analysis!
- Timeframe : 15 min.
- - Analysis generated on
- Status : TARGET REACHED

Summary of the analysis

Additional analysis
Quotes
The GOLD - USD rating is 2,887.47 USD. The price is lower by -1.09% since the last closing and was traded between 2,867.84 USD and 2,919.30 USD over the period. The price is currently at +0.68% from its lowest and -1.09% from its highest.The Central Gaps scanner detects a bullish opening. A small advantage for buyers in the very short term.
Bullish opening
Type : Bullish
Timeframe : Openning
So that you have an overall view of the price change, here is a table showing the variations over several periods:
New HIGH record (5 years)
Type : Bullish
Timeframe : Weekly
Near a new HIGH record (1 year)
Type : Bullish
Timeframe : Weekly
Near a new HIGH record (1st january)
Type : Bullish
Timeframe : Weekly
Near a new LOW record (1 month)
Type : Bearish
Timeframe : Weekly
Technical
Technical analysis of GOLD - USD in 15 min. shows an overall bearish trend. 67.86% of the signals given by moving averages are bearish. Caution: the slightly bullish signals currently given by short-term moving averages show a possible weakening of the global trend. The Central Indicators scanner does not detect any result on moving averages that would impact this trend.
The technical indicators are bullish. There is still some doubt about the price increase.
But beware of excesses. The Central Indicators scanner currently detects this:
Williams %R indicator is overbought : over -20
Type : Neutral
Timeframe : 15 minutes
Pivot points : price is under support 1
Type : Neutral
Timeframe : 15 minutes
Pivot points : price is under support 1
Type : Neutral
Timeframe : Weekly
The analysis of the price chart with Central Patterns scanners does not return any result.
Central Candlesticks, the scanner specialised in Japanese candlesticks, detects these bearish signals that could support the hypothesis of a small drop in the very short term:
Bearish harami
Type : Bearish
Timeframe : 15 minutes
Bearish harami cross
Type : Bearish
Timeframe : 15 minutes
| S3 | S2 | S1 | Price | R1 | R2 | R3 | |
|---|---|---|---|---|---|---|---|
| ProTrendLines | 2,720.21 | 2,785.43 | 2,877.00 | 2,887.47 | 2,891.25 | 2,906.72 | 2,916.78 |
| Change (%) | -5.79% | -3.53% | -0.36% | - | +0.13% | +0.67% | +1.02% |
| Change | -167.26 | -102.04 | -10.47 | - | +3.78 | +19.25 | +29.31 |
| Level | Intermediate | Minor | Minor | - | Major | Minor | Intermediate |
Pivot points can also be used to set your price objectives. Here is the price situation in relation to pivot points:
| Pivot points | S3 | S2 | S1 | PP | R1 | R2 | R3 |
|---|---|---|---|---|---|---|---|
| Standard | 2,857.40 | 2,874.13 | 2,896.70 | 2,913.43 | 2,936.00 | 2,952.73 | 2,975.30 |
| Camarilla | 2,908.45 | 2,912.06 | 2,915.66 | 2,919.26 | 2,922.86 | 2,926.47 | 2,930.07 |
| Woodie | 2,860.31 | 2,875.59 | 2,899.61 | 2,914.89 | 2,938.91 | 2,954.19 | 2,978.21 |
| Fibonacci | 2,874.13 | 2,889.15 | 2,898.42 | 2,913.43 | 2,928.45 | 2,937.72 | 2,952.73 |
| Pivot points | S3 | S2 | S1 | PP | R1 | R2 | R3 |
|---|---|---|---|---|---|---|---|
| Standard | 2,815.13 | 2,846.83 | 2,891.55 | 2,923.25 | 2,967.97 | 2,999.67 | 3,044.39 |
| Camarilla | 2,915.26 | 2,922.26 | 2,929.27 | 2,936.27 | 2,943.28 | 2,950.28 | 2,957.29 |
| Woodie | 2,821.64 | 2,850.09 | 2,898.06 | 2,926.51 | 2,974.48 | 3,002.93 | 3,050.90 |
| Fibonacci | 2,846.83 | 2,876.02 | 2,894.06 | 2,923.25 | 2,952.44 | 2,970.48 | 2,999.67 |
| Pivot points | S3 | S2 | S1 | PP | R1 | R2 | R3 |
|---|---|---|---|---|---|---|---|
| Standard | 2,469.07 | 2,541.90 | 2,671.55 | 2,744.38 | 2,874.03 | 2,946.86 | 3,076.51 |
| Camarilla | 2,745.53 | 2,764.09 | 2,782.65 | 2,801.21 | 2,819.77 | 2,838.33 | 2,856.89 |
| Woodie | 2,497.49 | 2,556.11 | 2,699.97 | 2,758.59 | 2,902.45 | 2,961.07 | 3,104.93 |
| Fibonacci | 2,541.90 | 2,619.24 | 2,667.03 | 2,744.38 | 2,821.72 | 2,869.51 | 2,946.86 |
Numerical data
The following is the status of technical indicators and moving averages registered at the time this technical analysis was created:
| RSI (14): | 54.02 | |
| MACD (12,26,9): | -0.8200 | |
| Directional Movement: | -3.47 | |
| AROON (14): | 85.71 | |
| DEMA (21): | 2,880.47 | |
| Parabolic SAR (0,02-0,02-0,2): | 2,870.34 | |
| Elder Ray (13): | 3.26 | |
| Super Trend (3,10): | 2,893.48 | |
| Zig ZAG (10): | 2,884.86 | |
| VORTEX (21): | 1.0300 | |
| Stochastique (14,3,5): | 84.70 | |
| TEMA (21): | 2,882.83 | |
| Williams %R (14): | -14.66 | |
| Chande Momentum Oscillator (20): | 12.37 | |
| Repulse (5,40,3): | 0.0800 | |
| ROCnROLL: | -1 | |
| TRIX (15,9): | -0.0100 | |
| Courbe Coppock: | 0.31 |
| MA7: | 2,926.83 | |
| MA20: | 2,895.10 | |
| MA50: | 2,765.53 | |
| MA100: | 2,718.61 | |
| MAexp7: | 2,883.29 | |
| MAexp20: | 2,881.52 | |
| MAexp50: | 2,886.46 | |
| MAexp100: | 2,894.47 | |
| Price / MA7: | -1.34% | |
| Price / MA20: | -0.26% | |
| Price / MA50: | +4.41% | |
| Price / MA100: | +6.21% | |
| Price / MAexp7: | +0.15% | |
| Price / MAexp20: | +0.21% | |
| Price / MAexp50: | +0.04% | |
| Price / MAexp100: | -0.24% |
News
Don't forget to follow the news on GOLD - USD. At the time of publication of this analysis, the latest news was as follows:
-
 XAU/USD Price Forecast Today, Technical Analysis (February 27): Gold Plunges Early on Thursday
-
Technical Analysis on BTCUSD, Gold, Oil
-
XAU/USD Price Forecast Today, Technical Analysis (February 26): Gold Markets Stabilize a Bit
-
How could Trump’s new ‘Gold Card’ immigration plan stimulate the US economy?
-
XAU/USD Price Forecast Today, Technical Analysis (February 25): Gold Fails to Follow Breakout
About author

Online


Add a comment
Comments
0 comments on the analysis GOLD - USD - 15 min.