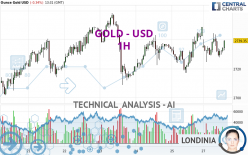
GOLD - USD - 1H - Technical analysis published on 10/28/2024 (GMT)
- 56
- 0
- Timeframe : 1H
- - Analysis generated on
- Status : IN PROGRESS...

Summary of the analysis

Additional analysis
Quotes
GOLD - USD rating 2,739.36 USD. The price registered a decrease of -0.34% on the session and was between 2,724.71 USD and 2,744.60 USD. This implies that the price is at +0.54% from its lowest and at -0.19% from its highest.The Central Gaps scanner detects a bearish opening marking the presence of sellers ahead of buyers at the opening but not sufficiently marked to allow the price to register a quotation gap.
Bearish opening
Type : Bearish
Timeframe : Openning
A study of price movements over other periods shows the following variations:
Near a new HIGH record (5 years)
Type : Bullish
Timeframe : Weekly
Near a new HIGH record (1 year)
Type : Bullish
Timeframe : Weekly
Near a new HIGH record (1st january)
Type : Bullish
Timeframe : Weekly
Near a new LOW record (1 month)
Type : Bearish
Timeframe : Weekly
Technical
Technical analysis of GOLD - USD in 1H shows a strongly overall bullish trend. The signals given by the moving averages are 89.29% bullish. This strong bullish trend is confirmed by the strong signals currently being given by short-term moving averages. The Central Indicators market scanner is currently detecting several bullish signals that could impact this trend:
Bullish trend reversal : adaptative moving average 20
Type : Bullish
Timeframe : 1 hour
Bullish trend reversal : adaptative moving average 50
Type : Bullish
Timeframe : 1 hour
Bullish price crossover with Moving Average 20
Type : Bullish
Timeframe : 1 hour
Bullish price crossover with Moving Average 100
Type : Bullish
Timeframe : 1 hour
Bullish price crossover with adaptative moving average 100
Type : Bullish
Timeframe : 1 hour
In fact, 10 technical indicators on 18 studied are currently bullish. Central Indicators, the scanner specialised in technical indicators, has identified these signals:
Price is back over the pivot point
Type : Bullish
Timeframe : 1 hour
Williams %R indicator is back over -50
Type : Bullish
Timeframe : 1 hour
No signals are given by Central Patterns, a market scanner specialised in chart patterns, resistances and supports.
The Central Candlesticks scanner, specialised in Japanese candlesticks, did not identify any signals.
| S3 | S2 | S1 | Price | R1 | R2 | |
|---|---|---|---|---|---|---|
| ProTrendLines | 2,672.68 | 2,685.35 | 2,714.20 | 2,739.36 | 2,743.31 | 2,758.50 |
| Change (%) | -2.43% | -1.97% | -0.92% | - | +0.14% | +0.70% |
| Change | -66.68 | -54.01 | -25.16 | - | +3.95 | +19.14 |
| Level | Intermediate | Minor | Major | - | Intermediate | Intermediate |
Attention could also be paid to pivot points to set price objectives:
| Pivot points | S3 | S2 | S1 | PP | R1 | R2 | R3 |
|---|---|---|---|---|---|---|---|
| Standard | 2,695.95 | 2,706.52 | 2,727.64 | 2,738.21 | 2,759.33 | 2,769.90 | 2,791.02 |
| Camarilla | 2,740.06 | 2,742.96 | 2,745.87 | 2,748.77 | 2,751.68 | 2,754.58 | 2,757.49 |
| Woodie | 2,701.24 | 2,709.16 | 2,732.93 | 2,740.85 | 2,764.62 | 2,772.54 | 2,796.31 |
| Fibonacci | 2,706.52 | 2,718.62 | 2,726.10 | 2,738.21 | 2,750.31 | 2,757.79 | 2,769.90 |
| Pivot points | S3 | S2 | S1 | PP | R1 | R2 | R3 |
|---|---|---|---|---|---|---|---|
| Standard | 2,669.21 | 2,689.02 | 2,718.89 | 2,738.70 | 2,768.57 | 2,788.38 | 2,818.25 |
| Camarilla | 2,735.11 | 2,739.66 | 2,744.22 | 2,748.77 | 2,753.32 | 2,757.88 | 2,762.43 |
| Woodie | 2,674.25 | 2,691.54 | 2,723.93 | 2,741.22 | 2,773.61 | 2,790.90 | 2,823.29 |
| Fibonacci | 2,689.02 | 2,707.99 | 2,719.72 | 2,738.70 | 2,757.67 | 2,769.40 | 2,788.38 |
| Pivot points | S3 | S2 | S1 | PP | R1 | R2 | R3 |
|---|---|---|---|---|---|---|---|
| Standard | 2,296.16 | 2,384.02 | 2,509.87 | 2,597.73 | 2,723.58 | 2,811.44 | 2,937.29 |
| Camarilla | 2,576.94 | 2,596.53 | 2,616.12 | 2,635.71 | 2,655.30 | 2,674.89 | 2,694.48 |
| Woodie | 2,315.15 | 2,393.52 | 2,528.86 | 2,607.23 | 2,742.57 | 2,820.94 | 2,956.28 |
| Fibonacci | 2,384.02 | 2,465.66 | 2,516.10 | 2,597.73 | 2,679.37 | 2,729.81 | 2,811.44 |
Numerical data
The following are the details of the technical indicators and moving averages that were collected to generate this technical analysis:
| RSI (14): | 53.99 | |
| MACD (12,26,9): | 0.3300 | |
| Directional Movement: | 4.28 | |
| AROON (14): | 35.71 | |
| DEMA (21): | 2,735.26 | |
| Parabolic SAR (0,02-0,02-0,2): | 2,743.59 | |
| Elder Ray (13): | 1.22 | |
| Super Trend (3,10): | 2,727.81 | |
| Zig ZAG (10): | 2,738.31 | |
| VORTEX (21): | 1.0100 | |
| Stochastique (14,3,5): | 49.65 | |
| TEMA (21): | 2,734.97 | |
| Williams %R (14): | -31.57 | |
| Chande Momentum Oscillator (20): | 6.09 | |
| Repulse (5,40,3): | 0.2900 | |
| ROCnROLL: | 1 | |
| TRIX (15,9): | 0.0000 | |
| Courbe Coppock: | 0.34 |
| MA7: | 2,733.24 | |
| MA20: | 2,680.24 | |
| MA50: | 2,604.24 | |
| MA100: | 2,496.04 | |
| MAexp7: | 2,735.07 | |
| MAexp20: | 2,734.57 | |
| MAexp50: | 2,733.59 | |
| MAexp100: | 2,729.89 | |
| Price / MA7: | +0.22% | |
| Price / MA20: | +2.21% | |
| Price / MA50: | +5.19% | |
| Price / MA100: | +9.75% | |
| Price / MAexp7: | +0.16% | |
| Price / MAexp20: | +0.18% | |
| Price / MAexp50: | +0.21% | |
| Price / MAexp100: | +0.35% |
News
Don't forget to follow the news on GOLD - USD. At the time of publication of this analysis, the latest news was as follows:
-
 Gold Continues to Consolidate: Forecast & Technical Analysis by Bruce Powers (October 25)
-
Gold Rallies for the Week but Looks Tired: Long Term Forecast by Chris Lewis (October 25)
-
Gold Continues to Consolidate: Forecast & Technical Analysis by Chris Lewis (October 25)
-
Gold Consolidates on Thursday: Forecast & Technical Analysis by Bruce Powers (October 24)
-
Gold Forecast October 25, 2024
About author

Online


Add a comment
Comments
0 comments on the analysis GOLD - USD - 1H