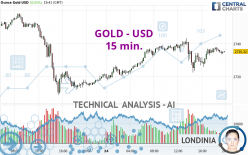
GOLD - USD - 15 min. - Technical analysis published on 10/24/2024 (GMT)
- 71
- 0
- Timeframe : 15 min.
- - Analysis generated on
- Status : IN PROGRESS...

Summary of the analysis

Additional analysis
Quotes
GOLD - USD rating 2,735.32 USD. The price registered an increase of +0.51% on the session with the lowest point at 2,717.86 USD and the highest point at 2,743.31 USD. The deviation from the price is +0.64% for the low point and -0.29% for the high point.A bullish opening was detected by the Central Gaps scanner. Buyers are trying to impose a bullish momentum in the very short term.
Bullish opening
Type : Bullish
Timeframe : Openning
Here is a more detailed summary of the historical variations registered by GOLD - USD:
New HIGH record (5 years)
Type : Bullish
Timeframe : Weekly
Near a new HIGH record (1 year)
Type : Bullish
Timeframe : Weekly
Near a new HIGH record (1st january)
Type : Bullish
Timeframe : Weekly
Near a new LOW record (1 month)
Type : Bearish
Timeframe : Weekly
Technical
A technical analysis in 15 min. of this GOLD - USD chart shows a bullish trend. The signals given by moving averages are 75.00% bullish. This bullish trend is slowing down slightly given the slightly bullish signals of short-term moving averages. An assessment of moving averages reveals several bearish and bullish signals:
Bearish price crossover with adaptative moving average 20
Type : Bearish
Timeframe : 15 minutes
Bullish price crossover with adaptative moving average 20
Type : Bullish
Timeframe : 15 minutes
The probability of a further increase are moderate given the direction of the technical indicators.
Central Indicators, the scanner specialised in technical indicators, has identified this signal:
RSI indicator is back under 50
Type : Bearish
Timeframe : 15 minutes
The analysis of the price chart with Central Patterns scanners does not return any result.
The Central Candlesticks scanner, specialised in Japanese candlesticks, did not identify any signals.
| S3 | S2 | S1 | Price | R1 | R2 | |
|---|---|---|---|---|---|---|
| ProTrendLines | 2,685.35 | 2,714.20 | 2,723.63 | 2,735.32 | 2,740.61 | 2,758.50 |
| Change (%) | -1.83% | -0.77% | -0.43% | - | +0.19% | +0.85% |
| Change | -49.97 | -21.12 | -11.69 | - | +5.29 | +23.18 |
| Level | Minor | Intermediate | Minor | - | Minor | Major |
Attention could also be paid to pivot points to set price objectives:
| Pivot points | S3 | S2 | S1 | PP | R1 | R2 | R3 |
|---|---|---|---|---|---|---|---|
| Standard | 2,650.92 | 2,679.87 | 2,700.60 | 2,729.55 | 2,750.28 | 2,779.23 | 2,799.96 |
| Camarilla | 2,707.67 | 2,712.22 | 2,716.78 | 2,721.33 | 2,725.88 | 2,730.44 | 2,734.99 |
| Woodie | 2,646.81 | 2,677.82 | 2,696.49 | 2,727.50 | 2,746.17 | 2,777.18 | 2,795.85 |
| Fibonacci | 2,679.87 | 2,698.85 | 2,710.57 | 2,729.55 | 2,748.53 | 2,760.25 | 2,779.23 |
| Pivot points | S3 | S2 | S1 | PP | R1 | R2 | R3 |
|---|---|---|---|---|---|---|---|
| Standard | 2,580.97 | 2,609.54 | 2,665.46 | 2,694.03 | 2,749.95 | 2,778.52 | 2,834.44 |
| Camarilla | 2,698.14 | 2,705.88 | 2,713.63 | 2,721.37 | 2,729.12 | 2,736.86 | 2,744.61 |
| Woodie | 2,594.64 | 2,616.38 | 2,679.13 | 2,700.87 | 2,763.62 | 2,785.36 | 2,848.11 |
| Fibonacci | 2,609.54 | 2,641.82 | 2,661.76 | 2,694.03 | 2,726.31 | 2,746.25 | 2,778.52 |
| Pivot points | S3 | S2 | S1 | PP | R1 | R2 | R3 |
|---|---|---|---|---|---|---|---|
| Standard | 2,296.16 | 2,384.02 | 2,509.87 | 2,597.73 | 2,723.58 | 2,811.44 | 2,937.29 |
| Camarilla | 2,576.94 | 2,596.53 | 2,616.12 | 2,635.71 | 2,655.30 | 2,674.89 | 2,694.48 |
| Woodie | 2,315.15 | 2,393.52 | 2,528.86 | 2,607.23 | 2,742.57 | 2,820.94 | 2,956.28 |
| Fibonacci | 2,384.02 | 2,465.66 | 2,516.10 | 2,597.73 | 2,679.37 | 2,729.81 | 2,811.44 |
Numerical data
The following are the details of the technical indicators and moving averages that were collected to generate this technical analysis:
| RSI (14): | 50.05 | |
| MACD (12,26,9): | 0.3300 | |
| Directional Movement: | -4.74 | |
| AROON (14): | 57.14 | |
| DEMA (21): | 2,734.99 | |
| Parabolic SAR (0,02-0,02-0,2): | 2,731.05 | |
| Elder Ray (13): | 0.09 | |
| Super Trend (3,10): | 2,739.95 | |
| Zig ZAG (10): | 2,734.70 | |
| VORTEX (21): | 1.1200 | |
| Stochastique (14,3,5): | 75.01 | |
| TEMA (21): | 2,735.32 | |
| Williams %R (14): | -21.17 | |
| Chande Momentum Oscillator (20): | 2.06 | |
| Repulse (5,40,3): | 0.0400 | |
| ROCnROLL: | 1 | |
| TRIX (15,9): | 0.0000 | |
| Courbe Coppock: | 0.34 |
| MA7: | 2,716.24 | |
| MA20: | 2,670.58 | |
| MA50: | 2,594.69 | |
| MA100: | 2,487.22 | |
| MAexp7: | 2,735.19 | |
| MAexp20: | 2,734.69 | |
| MAexp50: | 2,733.70 | |
| MAexp100: | 2,732.66 | |
| Price / MA7: | +0.70% | |
| Price / MA20: | +2.42% | |
| Price / MA50: | +5.42% | |
| Price / MA100: | +9.97% | |
| Price / MAexp7: | +0.00% | |
| Price / MAexp20: | +0.02% | |
| Price / MAexp50: | +0.06% | |
| Price / MAexp100: | +0.10% |
News
Don't forget to follow the news on GOLD - USD. At the time of publication of this analysis, the latest news was as follows:
-
 Gold Forecast October 25, 2024
-
Gold Hits Target and Turns Down: Forecast & Technical Analysis by Bruce Powers (October 23)
-
Gold Stalls a Bit on Wednesday: Forecast & Technical Analysis by Chris Lewis (October 23)
-
DW tours hospital and area where Israel says Hezbollah is hoarding gold | DW News
-
Gold Reaches Another New Record High: Forecast & Technical Analysis by Bruce Powers (October 22)
About author

Online


Add a comment
Comments
0 comments on the analysis GOLD - USD - 15 min.