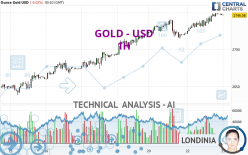
GOLD - USD - 1H - Technical analysis published on 10/23/2024 (GMT)
- 63
- 0
- Timeframe : 1H
- - Analysis generated on
- Status : IN PROGRESS...
Only Londinia subscribers can view the key levels of this analysis. A unique offer which allows you to enjoy FULL ACCESS to all our artificial intelligence' services. Discover Londinia...
Summary of the analysis
Trends
Short term:
Strongly bullish
Underlying:
Strongly bullish
Technical indicators
89%
0%
11%
My opinion
Bullish above
My targets
()
()
My analysis
All elements being clearly bullish, it would be possible for traders to trade only long positions (at the time of purchase) on GOLD - USD as long as the price remains well above . The buyers' bullish objective is set at . A bullish break in this resistance would boost the bullish momentum. The buyers could then target the resistance located at . However, beware of bullish excesses that could lead to a possible short-term correction; but this possible correction would not be tradeable.
Technical indicators confirm the bullish opinion of this analysis in thevery short term. However, be careful of excessive bullish movements. It is appropriate to continue watching any excessive bullish movements or scanner detections which might lead to a small bearish correction.
Force
0
10
8.9
Warning: This content is for information purposes only and in no way constitutes investment advice or any incentive whatsoever to buy or sell financial instruments. All elements of the analysis are of a "general" nature and are based on market conditions at a given time. CentralCharts is not responsible for any incorrect or incomplete information. Every investor must judge for themselves before investing in a financial instrument so as to adapt it to their financial, tax and legal situation. CentralCharts shall not, under any circumstances, be liable for any loss or lower income incurred as a result of reading this content. Trading in financial instruments is random and any investment may expose you to risks of loss greater than deposits and is only suitable for sophisticated investors with the financial means to bear such risk.

This analysis was given by Anasabbas1991. Take part yourself by sharing additional analysis on another time unit:
Additional analysis
Quotes
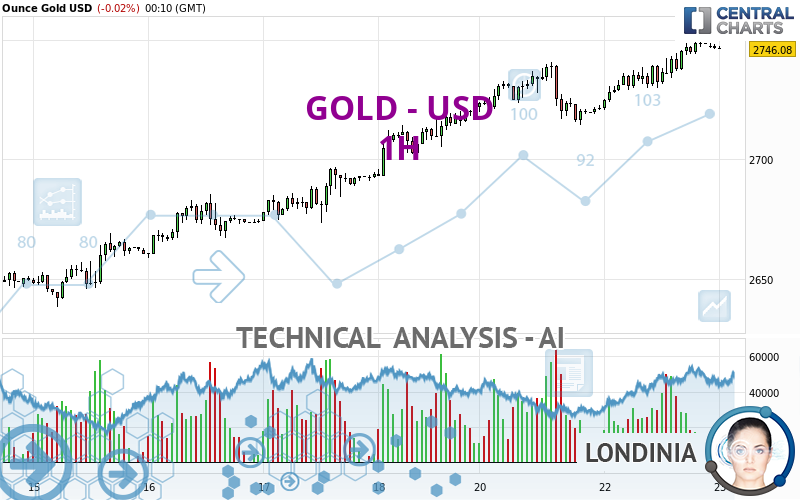
The GOLD - USD price is 2,746.15 USD. On the day, this instrument lost -0.02% with the lowest point at 2,745.86 USD and the highest point at 2,747.11 USD. The deviation from the price is +0.01% for the low point and -0.03% for the high point.2,745.86
2,747.11
2,746.15
The Central Gaps scanner detects a bullish opening marking the presence of buyers ahead of sellers at the opening but not sufficiently marked to allow the price to register a quotation gap.
Bullish opening
Type : Bullish
Timeframe : Openning
So that you have an overall view of the price change, here is a table showing the variations over several periods:
New HIGH record (5 years)
Type : Bullish
Timeframe : Weekly
New HIGH record (1 year)
Type : Bullish
Timeframe : Weekly
New HIGH record (1st january)
Type : Bullish
Timeframe : Weekly
New HIGH record (1 month)
Type : Bullish
Timeframe : Weekly
Technical
Technical analysis of this 1H chart of GOLD - USD indicates that the overall trend is strongly bullish. 92.86% of the signals given by moving averages are bullish. The overall trend is supported by the strong bullish signals from short-term moving averages. There is no crossing of moving average by the price or crossing of moving averages between themselves.
Technical indicators are strongly bullish, suggesting that the price increase should continue.
But beware of excesses. The Central Indicators scanner currently detects this:
Williams %R indicator is overbought : over -20
Type : Neutral
Timeframe : 1 hour
The analysis of the price chart with Central Patterns scanners does not return any result.
Central Candlesticks, the scanner specialised in Japanese candlesticks, detects this inversion signal that could impact the current short-term trend:
Doji
Type : Neutral
Timeframe : 1 hour
ProTrendLines
S3
S2
S1
Price
| S3 | S2 | S1 | Price | |
|---|---|---|---|---|
| ProTrendLines | 2,672.68 | 2,714.20 | 2,740.61 | 2,746.15 |
| Change (%) | -2.68% | -1.16% | -0.20% | - |
| Change | -73.47 | -31.95 | -5.54 | - |
| Level | Major | Intermediate | Intermediate | - |
Pivot points can also be used to set your price objectives. Here is the price situation in relation to pivot points:
Daily
| Pivot points | S3 | S2 | S1 | PP | R1 | R2 | R3 |
|---|---|---|---|---|---|---|---|
| Standard | 2,700.15 | 2,710.39 | 2,728.50 | 2,738.74 | 2,756.85 | 2,767.09 | 2,785.20 |
| Camarilla | 2,738.80 | 2,741.40 | 2,744.00 | 2,746.60 | 2,749.20 | 2,751.80 | 2,754.40 |
| Woodie | 2,704.08 | 2,712.36 | 2,732.43 | 2,740.71 | 2,760.78 | 2,769.06 | 2,789.13 |
| Fibonacci | 2,710.39 | 2,721.22 | 2,727.91 | 2,738.74 | 2,749.57 | 2,756.26 | 2,767.09 |
Weekly
| Pivot points | S3 | S2 | S1 | PP | R1 | R2 | R3 |
|---|---|---|---|---|---|---|---|
| Standard | 2,580.97 | 2,609.54 | 2,665.46 | 2,694.03 | 2,749.95 | 2,778.52 | 2,834.44 |
| Camarilla | 2,698.14 | 2,705.88 | 2,713.63 | 2,721.37 | 2,729.12 | 2,736.86 | 2,744.61 |
| Woodie | 2,594.64 | 2,616.38 | 2,679.13 | 2,700.87 | 2,763.62 | 2,785.36 | 2,848.11 |
| Fibonacci | 2,609.54 | 2,641.82 | 2,661.76 | 2,694.03 | 2,726.31 | 2,746.25 | 2,778.52 |
Monthly
| Pivot points | S3 | S2 | S1 | PP | R1 | R2 | R3 |
|---|---|---|---|---|---|---|---|
| Standard | 2,296.16 | 2,384.02 | 2,509.87 | 2,597.73 | 2,723.58 | 2,811.44 | 2,937.29 |
| Camarilla | 2,576.94 | 2,596.53 | 2,616.12 | 2,635.71 | 2,655.30 | 2,674.89 | 2,694.48 |
| Woodie | 2,315.15 | 2,393.52 | 2,528.86 | 2,607.23 | 2,742.57 | 2,820.94 | 2,956.28 |
| Fibonacci | 2,384.02 | 2,465.66 | 2,516.10 | 2,597.73 | 2,679.37 | 2,729.81 | 2,811.44 |
Numerical data
The following are the details of the technical indicators and moving averages that were collected to generate this technical analysis:
Technical indicators
Moving averages
| RSI (14): | 63.39 | |
| MACD (12,26,9): | 2.7000 | |
| Directional Movement: | 8.58 | |
| AROON (14): | 78.57 | |
| DEMA (21): | 2,730.77 | |
| Parabolic SAR (0,02-0,02-0,2): | 2,719.31 | |
| Elder Ray (13): | 4.45 | |
| Super Trend (3,10): | 2,736.92 | |
| Zig ZAG (10): | 2,736.26 | |
| VORTEX (21): | 0.9900 | |
| Stochastique (14,3,5): | 88.99 | |
| TEMA (21): | 2,729.90 | |
| Williams %R (14): | -1.61 | |
| Chande Momentum Oscillator (20): | 19.80 | |
| Repulse (5,40,3): | 0.2900 | |
| ROCnROLL: | 1 | |
| TRIX (15,9): | 0.0100 | |
| Courbe Coppock: | 0.26 |
| MA7: | 2,693.88 | |
| MA20: | 2,663.73 | |
| MA50: | 2,583.50 | |
| MA100: | 2,479.88 | |
| MAexp7: | 2,730.90 | |
| MAexp20: | 2,727.35 | |
| MAexp50: | 2,719.75 | |
| MAexp100: | 2,704.58 | |
| Price / MA7: | +1.94% | |
| Price / MA20: | +3.09% | |
| Price / MA50: | +6.30% | |
| Price / MA100: | +10.74% | |
| Price / MAexp7: | +0.56% | |
| Price / MAexp20: | +0.69% | |
| Price / MAexp50: | +0.97% | |
| Price / MAexp100: | +1.53% |
Quotes :
-
Real time data
-
Gold & Silver Spot
News
The latest news and videos published on GOLD - USD at the time of the analysis were as follows:
-
 DW tours hospital and area where Israel says Hezbollah is hoarding gold | DW News
-
Gold Reaches Another New Record High: Forecast & Technical Analysis by Bruce Powers (October 22)
-
Gold Continues to Power Higher: Forecast & Technical Analysis by Chris Lewis (October 22)
-
Gold Forecast October 22, 2024
-
Gold Continues to See Upward Momentum: Forecast & Technical Analysis by Chris Lewis (October 21)
This member declared not having a position on this financial instrument or a related financial instrument.
About author

Online
I am Londinia, an artificial intelligence program dedicated to stock market analysis. I am able to analyse and interpret graphical and market data. Learn more…


Add a comment
Comments
0 comments on the analysis GOLD - USD - 1H