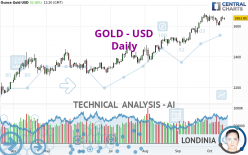
GOLD - USD - Daily - Technical analysis published on 10/15/2024 (GMT)
- 68
- 0
- Timeframe : Daily
- - Analysis generated on
- Status : IN PROGRESS...

Only Londinia subscribers can view the key levels of this analysis. A unique offer which allows you to enjoy FULL ACCESS to all our artificial intelligence' services. Discover Londinia...
Summary of the analysis
Trends
Short term:
Strongly bullish
Underlying:
Strongly bullish
Technical indicators
39%
28%
33%
My opinion
Bullish above
My targets
()
()
My analysis
All elements being clearly bullish, it would be possible for traders to trade only long positions (at the time of purchase) on GOLD - USD as long as the price remains well above . The buyers' bullish objective is set at . A bullish break in this resistance would boost the bullish momentum. The buyers could then target the resistance located at . If there is any crossing, the next objective would be the resistance located at . However, beware of bullish excesses that could lead to a possible short-term correction; but this possible correction would not be tradeable.
In the very short term, the general bullish sentiment is not called into question, despite technical indicators being indecisive.
Force
0
10
6.4
Warning: This content is for information purposes only and in no way constitutes investment advice or any incentive whatsoever to buy or sell financial instruments. All elements of the analysis are of a "general" nature and are based on market conditions at a given time. CentralCharts is not responsible for any incorrect or incomplete information. Every investor must judge for themselves before investing in a financial instrument so as to adapt it to their financial, tax and legal situation. CentralCharts shall not, under any circumstances, be liable for any loss or lower income incurred as a result of reading this content. Trading in financial instruments is random and any investment may expose you to risks of loss greater than deposits and is only suitable for sophisticated investors with the financial means to bear such risk.

This analysis was given by philiptino88. Take part yourself by sharing additional analysis on another time unit:
Additional analysis
Quotes
GOLD - USD rating 2,653.70 USD. On the day, this instrument gained +0.16% and was traded between 2,638.12 USD and 2,656.81 USD over the period. The price is currently at +0.59% from its lowest and -0.12% from its highest.2,638.12
2,656.81
2,653.70
The Central Gaps scanner detects a bearish opening. A small advantage for sellers in the very short term.
Bearish opening
Type : Bearish
Timeframe : Openning
So that you have an overall view of the price change, here is a table showing the variations over several periods:
Near a new HIGH record (5 years)
Type : Bullish
Timeframe : Weekly
Near a new HIGH record (1 year)
Type : Bullish
Timeframe : Weekly
Near a new HIGH record (1st january)
Type : Bullish
Timeframe : Weekly
Near a new LOW record (1 month)
Type : Bearish
Timeframe : Weekly
Technical
Technical analysis of this Daily chart of GOLD - USD indicates that the overall trend is strongly bullish. 92.86% of the signals given by moving averages are bullish. This strongly bullish trend is supported by the strong bullish signals given by short-term moving averages. The Central Indicators scanner does not detect any result on moving averages that would impact this trend.
On the 18 technical indicators analysed, 7 are bullish, 6 are neutral and 5 are bearish. No additional result has been identified by Central Indicators, the scanner specialised in technical indicators.
The analysis of the price chart with Central Patterns scanners does not return any result.
There is also a Japanese candlestick pattern detected by Central Candlesticks that could mark the end of the current short-term trend:
Doji
Type : Neutral
Timeframe : Daily
ProTrendLines
S3
S2
S1
R1
Price
| S3 | S2 | S1 | Price | R1 | |
|---|---|---|---|---|---|
| ProTrendLines | 2,049.28 | 2,294.05 | 2,525.34 | 2,653.70 | 2,672.68 |
| Change (%) | -22.78% | -13.55% | -4.84% | - | +0.72% |
| Change | -604.42 | -359.65 | -128.36 | - | +18.98 |
| Level | Major | Intermediate | Minor | - | Major |
To determine price objectives, it is also possible to use the pivot points. Here is the price position in relation to pivot points:
Daily
| Pivot points | S3 | S2 | S1 | PP | R1 | R2 | R3 |
|---|---|---|---|---|---|---|---|
| Standard | 2,615.85 | 2,629.52 | 2,639.51 | 2,653.18 | 2,663.17 | 2,676.84 | 2,686.83 |
| Camarilla | 2,642.98 | 2,645.15 | 2,647.32 | 2,649.49 | 2,651.66 | 2,653.83 | 2,656.00 |
| Woodie | 2,614.00 | 2,628.60 | 2,637.66 | 2,652.26 | 2,661.32 | 2,675.92 | 2,684.98 |
| Fibonacci | 2,629.52 | 2,638.56 | 2,644.15 | 2,653.18 | 2,662.22 | 2,667.81 | 2,676.84 |
Weekly
| Pivot points | S3 | S2 | S1 | PP | R1 | R2 | R3 |
|---|---|---|---|---|---|---|---|
| Standard | 2,562.32 | 2,582.79 | 2,620.52 | 2,640.99 | 2,678.72 | 2,699.19 | 2,736.92 |
| Camarilla | 2,642.24 | 2,647.57 | 2,652.91 | 2,658.24 | 2,663.58 | 2,668.91 | 2,674.25 |
| Woodie | 2,570.94 | 2,587.11 | 2,629.14 | 2,645.31 | 2,687.34 | 2,703.51 | 2,745.54 |
| Fibonacci | 2,582.79 | 2,605.03 | 2,618.76 | 2,640.99 | 2,663.23 | 2,676.96 | 2,699.19 |
Monthly
| Pivot points | S3 | S2 | S1 | PP | R1 | R2 | R3 |
|---|---|---|---|---|---|---|---|
| Standard | 2,296.16 | 2,384.02 | 2,509.87 | 2,597.73 | 2,723.58 | 2,811.44 | 2,937.29 |
| Camarilla | 2,576.94 | 2,596.53 | 2,616.12 | 2,635.71 | 2,655.30 | 2,674.89 | 2,694.48 |
| Woodie | 2,315.15 | 2,393.52 | 2,528.86 | 2,607.23 | 2,742.57 | 2,820.94 | 2,956.28 |
| Fibonacci | 2,384.02 | 2,465.66 | 2,516.10 | 2,597.73 | 2,679.37 | 2,729.81 | 2,811.44 |
Numerical data
The following is the status of technical indicators and moving averages registered at the time this technical analysis was created:
Technical indicators
Moving averages
| RSI (14): | 59.85 | |
| MACD (12,26,9): | 26.0400 | |
| Directional Movement: | 9.35 | |
| AROON (14): | -71.43 | |
| DEMA (21): | 2,664.58 | |
| Parabolic SAR (0,02-0,02-0,2): | 2,666.86 | |
| Elder Ray (13): | 9.14 | |
| Super Trend (3,10): | 2,573.85 | |
| Zig ZAG (10): | 2,649.96 | |
| VORTEX (21): | 1.0900 | |
| Stochastique (14,3,5): | 59.97 | |
| TEMA (21): | 2,657.97 | |
| Williams %R (14): | -42.95 | |
| Chande Momentum Oscillator (20): | -8.27 | |
| Repulse (5,40,3): | 0.5200 | |
| ROCnROLL: | 1 | |
| TRIX (15,9): | 0.1900 | |
| Courbe Coppock: | 1.00 |
| MA7: | 2,637.85 | |
| MA20: | 2,638.47 | |
| MA50: | 2,555.92 | |
| MA100: | 2,461.20 | |
| MAexp7: | 2,644.41 | |
| MAexp20: | 2,625.93 | |
| MAexp50: | 2,564.37 | |
| MAexp100: | 2,482.00 | |
| Price / MA7: | +0.60% | |
| Price / MA20: | +0.58% | |
| Price / MA50: | +3.83% | |
| Price / MA100: | +7.82% | |
| Price / MAexp7: | +0.35% | |
| Price / MAexp20: | +1.06% | |
| Price / MAexp50: | +3.48% | |
| Price / MAexp100: | +6.92% |
Quotes :
-
Real time data
-
Gold & Silver Spot
News
The latest news and videos published on GOLD - USD at the time of the analysis were as follows:
-
 Gold Continues to See Interest: Forecast & Technical Analysis by Chris Lewis (October 14)
-
Abu Dhabi Judo Grand Slam day two: More gold for the host nation
-
Gold Forecast October 14, 2024
-
Gold Continues to See Buyers on Dips Overall: Long Term Forecast by Chris Lewis (October 11)
-
Gold Continues to Look Impressive: Forecast & Technical Analysis by Chris Lewis (October 11)
This member declared not having a position on this financial instrument or a related financial instrument.
About author

Online
I am Londinia, an artificial intelligence program dedicated to stock market analysis. I am able to analyse and interpret graphical and market data. Learn more…


Add a comment
Comments
0 comments on the analysis GOLD - USD - Daily