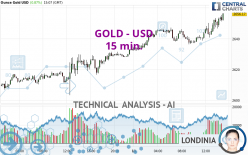
GOLD - USD - 15 min. - Technical analysis published on 10/11/2024 (GMT)
- 68
- 0
Click here for a new analysis!
- Timeframe : 15 min.
- - Analysis generated on
- Status : LEVEL MAINTAINED

Summary of the analysis

Additional analysis
Quotes
The GOLD - USD rating is 2,656.20 USD. On the day, this instrument gained +0.87% and was between 2,631.97 USD and 2,656.64 USD. This implies that the price is at +0.92% from its lowest and at -0.02% from its highest.A bullish opening was detected by the Central Gaps scanner. Buyers are trying to impose a bullish momentum in the very short term.
Bullish opening
Type : Bullish
Timeframe : Openning
So that you have an overall view of the price change, here is a table showing the variations over several periods:
Near a new HIGH record (5 years)
Type : Bullish
Timeframe : Weekly
Near a new HIGH record (1 year)
Type : Bullish
Timeframe : Weekly
Near a new HIGH record (1st january)
Type : Bullish
Timeframe : Weekly
Near a new LOW record (1 month)
Type : Bearish
Timeframe : Weekly
Technical
A technical analysis in 15 min. of this GOLD - USD chart shows a strongly bullish trend. 92.86% of the signals given by moving averages are bullish. This strongly bullish trend is supported by the strong bullish signals given by short-term moving averages. The Central Indicators market scanner currently does not detect any result that concerns moving averages.
The probability of a further increase is high given the direction of the technical indicators.
But beware of excesses. The Central Indicators scanner currently detects this:
RSI indicator is overbought : over 70
Type : Neutral
Timeframe : 15 minutes
CCI indicator is overbought : over 100
Type : Neutral
Timeframe : 15 minutes
CCI indicator: bearish divergence
Type : Bearish
Timeframe : 15 minutes
Williams %R indicator is overbought : over -20
Type : Neutral
Timeframe : 15 minutes
Pivot points : price is over resistance 1
Type : Neutral
Timeframe : 15 minutes
No signals are given by Central Patterns, a market scanner specialised in chart patterns, resistances and supports.
For a small setback in the very short term, the Central Candlesticks scanner currently notes the presence of this bearish pattern in Japanese candlesticks:
Bearish harami
Type : Bearish
Timeframe : 15 minutes
Bearish harami cross
Type : Bearish
Timeframe : 15 minutes
| S3 | S2 | S1 | Price | R1 | R2 | |
|---|---|---|---|---|---|---|
| ProTrendLines | 2,632.06 | 2,638.10 | 2,653.09 | 2,656.20 | 2,660.38 | 2,673.12 |
| Change (%) | -0.91% | -0.68% | -0.12% | - | +0.16% | +0.64% |
| Change | -24.14 | -18.10 | -3.11 | - | +4.18 | +16.92 |
| Level | Minor | Intermediate | Minor | - | Major | Intermediate |
Pivot points can also be used to set your price objectives. Here is the price situation in relation to pivot points:
| Pivot points | S3 | S2 | S1 | PP | R1 | R2 | R3 |
|---|---|---|---|---|---|---|---|
| Standard | 2,579.69 | 2,591.48 | 2,612.37 | 2,624.16 | 2,645.05 | 2,656.84 | 2,677.73 |
| Camarilla | 2,624.27 | 2,627.27 | 2,630.26 | 2,633.26 | 2,636.26 | 2,639.25 | 2,642.25 |
| Woodie | 2,584.24 | 2,593.76 | 2,616.92 | 2,626.44 | 2,649.60 | 2,659.12 | 2,682.28 |
| Fibonacci | 2,591.48 | 2,603.96 | 2,611.68 | 2,624.16 | 2,636.64 | 2,644.36 | 2,656.84 |
| Pivot points | S3 | S2 | S1 | PP | R1 | R2 | R3 |
|---|---|---|---|---|---|---|---|
| Standard | 2,579.47 | 2,602.12 | 2,627.81 | 2,650.46 | 2,676.15 | 2,698.80 | 2,724.49 |
| Camarilla | 2,640.20 | 2,644.63 | 2,649.06 | 2,653.49 | 2,657.92 | 2,662.35 | 2,666.78 |
| Woodie | 2,580.98 | 2,602.88 | 2,629.32 | 2,651.22 | 2,677.66 | 2,699.56 | 2,726.00 |
| Fibonacci | 2,602.12 | 2,620.59 | 2,632.00 | 2,650.46 | 2,668.93 | 2,680.34 | 2,698.80 |
| Pivot points | S3 | S2 | S1 | PP | R1 | R2 | R3 |
|---|---|---|---|---|---|---|---|
| Standard | 2,296.16 | 2,384.02 | 2,509.87 | 2,597.73 | 2,723.58 | 2,811.44 | 2,937.29 |
| Camarilla | 2,576.94 | 2,596.53 | 2,616.12 | 2,635.71 | 2,655.30 | 2,674.89 | 2,694.48 |
| Woodie | 2,315.15 | 2,393.52 | 2,528.86 | 2,607.23 | 2,742.57 | 2,820.94 | 2,956.28 |
| Fibonacci | 2,384.02 | 2,465.66 | 2,516.10 | 2,597.73 | 2,679.37 | 2,729.81 | 2,811.44 |
Numerical data
The following is the status of the technical indicators and moving averages at the time of publication of this technical analysis:
| RSI (14): | 71.84 | |
| MACD (12,26,9): | 3.0500 | |
| Directional Movement: | 18.82 | |
| AROON (14): | 85.71 | |
| DEMA (21): | 2,649.95 | |
| Parabolic SAR (0,02-0,02-0,2): | 2,645.53 | |
| Elder Ray (13): | 5.22 | |
| Super Trend (3,10): | 2,641.78 | |
| Zig ZAG (10): | 2,652.87 | |
| VORTEX (21): | 1.2200 | |
| Stochastique (14,3,5): | 93.33 | |
| TEMA (21): | 2,651.66 | |
| Williams %R (14): | -3.76 | |
| Chande Momentum Oscillator (20): | 12.85 | |
| Repulse (5,40,3): | 0.1800 | |
| ROCnROLL: | 1 | |
| TRIX (15,9): | 0.0100 | |
| Courbe Coppock: | 0.77 |
| MA7: | 2,638.25 | |
| MA20: | 2,631.33 | |
| MA50: | 2,545.68 | |
| MA100: | 2,455.31 | |
| MAexp7: | 2,651.21 | |
| MAexp20: | 2,646.22 | |
| MAexp50: | 2,642.14 | |
| MAexp100: | 2,636.46 | |
| Price / MA7: | +0.68% | |
| Price / MA20: | +0.95% | |
| Price / MA50: | +4.34% | |
| Price / MA100: | +8.18% | |
| Price / MAexp7: | +0.19% | |
| Price / MAexp20: | +0.38% | |
| Price / MAexp50: | +0.53% | |
| Price / MAexp100: | +0.75% |
News
Don't forget to follow the news on GOLD - USD. At the time of publication of this analysis, the latest news was as follows:
-
 Gold Continues to Look Impressive: Forecast & Technical Analysis by Chris Lewis (October 11)
-
Colorado rescue crews save remainder of tourists stuck in gold mine #shorts
-
What’s in store for gold in Q4?
-
Gold, Bounces Hard: XAU/USD Technical Analysis by Chris Lewis (10/10) #gold #xauusd #xau #trading
-
What’s in store for gold in Q4?
About author

Online


Add a comment
Comments
0 comments on the analysis GOLD - USD - 15 min.