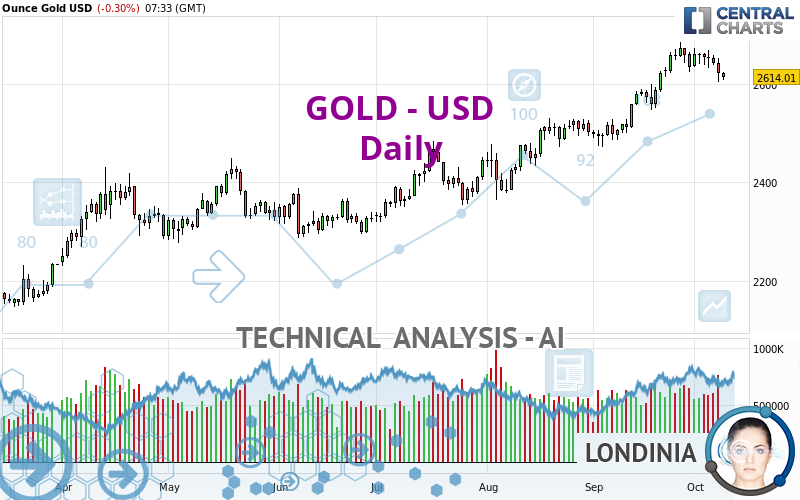
GOLD - USD - Daily - Technical analysis published on 10/09/2024 (GMT)
- 68
- 0
- Timeframe : Daily
- - Analysis generated on
- Status : IN PROGRESS...

Only Londinia subscribers can view the key levels of this analysis. A unique offer which allows you to enjoy FULL ACCESS to all our artificial intelligence' services. Discover Londinia...
Summary of the analysis
Trends
Short term:
Neutral
Underlying:
Bullish
Technical indicators
11%
50%
39%
My opinion
Bullish above
My targets
()
My analysis
We are currently in a phase of short-term indecision. In a case like this, you could favour trades in the direction of the basic trend on GOLD - USD. As long as you are above the support located at , traders with an aggressive trading strategy could consider a purchase. A cross of the resistance located at would be a signal that the basic trade will reverse and the short-term trend could then quickly become bullish. If the support were to be broken, this would simply be a sign of a possible continuation of short-term consolidation and trading against the trend would then perhaps be more risky.
In the very short term, the general bullish opinion of this analysis is in opposition with technical indicators. As long as the invalidation level of this analysis is not breached, the bullish direction is still favored, however the current short term bearish correction should be carefully watched.
Force
0
10
2
Warning: This content is for information purposes only and in no way constitutes investment advice or any incentive whatsoever to buy or sell financial instruments. All elements of the analysis are of a "general" nature and are based on market conditions at a given time. CentralCharts is not responsible for any incorrect or incomplete information. Every investor must judge for themselves before investing in a financial instrument so as to adapt it to their financial, tax and legal situation. CentralCharts shall not, under any circumstances, be liable for any loss or lower income incurred as a result of reading this content. Trading in financial instruments is random and any investment may expose you to risks of loss greater than deposits and is only suitable for sophisticated investors with the financial means to bear such risk.

This analysis was given by Christophe lego. Take part yourself by sharing additional analysis on another time unit:
Additional analysis
Quotes
GOLD - USD rating 2,613.99 USD. The price registered a decrease of -0.31% on the session with the lowest point at 2,609.24 USD and the highest point at 2,624.38 USD. The deviation from the price is +0.18% for the low point and -0.40% for the high point.2,609.24
2,624.38
2,613.99
A bullish opening was detected by the Central Gaps scanner. Buyers are trying to impose a bullish momentum in the very short term.
Bullish opening
Type : Bullish
Timeframe : Openning
A study of price movements over other periods shows the following variations:
Near a new HIGH record (5 years)
Type : Bullish
Timeframe : Weekly
Near a new HIGH record (1 year)
Type : Bullish
Timeframe : Weekly
Near a new HIGH record (1st january)
Type : Bullish
Timeframe : Weekly
Near a new LOW record (1 month)
Type : Bearish
Timeframe : Weekly
Technical
Technical analysis of GOLD - USD in Daily shows an overall bullish trend. 75.00% of the signals given by moving averages are bullish. Caution: the neutral signals currently given by short-term moving averages show us that the global trend is losing momentum. There is no crossing of moving average by the price or crossing of moving averages between themselves.
In fact, according to the parameters integrated into the Central Analyzer system, only 9 technical indicators out of 18 analysed are currently bearish. Central Indicators, the scanner specialised in technical indicators, has identified these signals:
Pivot points : price is under support 1
Type : Neutral
Timeframe : Weekly
Williams %R indicator is back under -50
Type : Bearish
Timeframe : Daily
The analysis of the price chart with Central Patterns scanners does not return any result.
The Central Candlesticks scanner, specialised in Japanese candlesticks, did not identify any signals.
ProTrendLines
S3
S2
S1
R1
Price
| S3 | S2 | S1 | Price | R1 | |
|---|---|---|---|---|---|
| ProTrendLines | 2,049.28 | 2,294.05 | 2,525.34 | 2,613.99 | 2,672.68 |
| Change (%) | -21.60% | -12.24% | -3.39% | - | +2.25% |
| Change | -564.71 | -319.94 | -88.65 | - | +58.69 |
| Level | Major | Intermediate | Minor | - | Major |
Pivot points can also be used to set your price objectives. Here is the price situation in relation to pivot points:
Daily
| Pivot points | S3 | S2 | S1 | PP | R1 | R2 | R3 |
|---|---|---|---|---|---|---|---|
| Standard | 2,551.89 | 2,578.35 | 2,600.17 | 2,626.63 | 2,648.45 | 2,674.91 | 2,696.73 |
| Camarilla | 2,608.71 | 2,613.14 | 2,617.56 | 2,621.99 | 2,626.42 | 2,630.84 | 2,635.27 |
| Woodie | 2,549.57 | 2,577.19 | 2,597.85 | 2,625.47 | 2,646.13 | 2,673.75 | 2,694.41 |
| Fibonacci | 2,578.35 | 2,596.79 | 2,608.19 | 2,626.63 | 2,645.07 | 2,656.47 | 2,674.91 |
Weekly
| Pivot points | S3 | S2 | S1 | PP | R1 | R2 | R3 |
|---|---|---|---|---|---|---|---|
| Standard | 2,579.47 | 2,602.12 | 2,627.81 | 2,650.46 | 2,676.15 | 2,698.80 | 2,724.49 |
| Camarilla | 2,640.20 | 2,644.63 | 2,649.06 | 2,653.49 | 2,657.92 | 2,662.35 | 2,666.78 |
| Woodie | 2,580.98 | 2,602.88 | 2,629.32 | 2,651.22 | 2,677.66 | 2,699.56 | 2,726.00 |
| Fibonacci | 2,602.12 | 2,620.59 | 2,632.00 | 2,650.46 | 2,668.93 | 2,680.34 | 2,698.80 |
Monthly
| Pivot points | S3 | S2 | S1 | PP | R1 | R2 | R3 |
|---|---|---|---|---|---|---|---|
| Standard | 2,296.16 | 2,384.02 | 2,509.87 | 2,597.73 | 2,723.58 | 2,811.44 | 2,937.29 |
| Camarilla | 2,576.94 | 2,596.53 | 2,616.12 | 2,635.71 | 2,655.30 | 2,674.89 | 2,694.48 |
| Woodie | 2,315.15 | 2,393.52 | 2,528.86 | 2,607.23 | 2,742.57 | 2,820.94 | 2,956.28 |
| Fibonacci | 2,384.02 | 2,465.66 | 2,516.10 | 2,597.73 | 2,679.37 | 2,729.81 | 2,811.44 |
Numerical data
The following is the status of technical indicators and moving averages registered at the time this technical analysis was created:
Technical indicators
Moving averages
| RSI (14): | 53.85 | |
| MACD (12,26,9): | 30.6700 | |
| Directional Movement: | 2.63 | |
| AROON (14): | 35.71 | |
| DEMA (21): | 2,660.34 | |
| Parabolic SAR (0,02-0,02-0,2): | 2,680.33 | |
| Elder Ray (13): | -11.96 | |
| Super Trend (3,10): | 2,573.85 | |
| Zig ZAG (10): | 2,612.45 | |
| VORTEX (21): | 1.1700 | |
| Stochastique (14,3,5): | 49.65 | |
| TEMA (21): | 2,657.05 | |
| Williams %R (14): | -72.58 | |
| Chande Momentum Oscillator (20): | -13.88 | |
| Repulse (5,40,3): | -1.2500 | |
| ROCnROLL: | -1 | |
| TRIX (15,9): | 0.2200 | |
| Courbe Coppock: | 4.43 |
| MA7: | 2,643.73 | |
| MA20: | 2,624.03 | |
| MA50: | 2,537.79 | |
| MA100: | 2,449.13 | |
| MAexp7: | 2,634.44 | |
| MAexp20: | 2,615.64 | |
| MAexp50: | 2,550.13 | |
| MAexp100: | 2,468.40 | |
| Price / MA7: | -1.12% | |
| Price / MA20: | -0.38% | |
| Price / MA50: | +3.00% | |
| Price / MA100: | +6.73% | |
| Price / MAexp7: | -0.78% | |
| Price / MAexp20: | -0.06% | |
| Price / MAexp50: | +2.50% | |
| Price / MAexp100: | +5.90% |
Quotes :
-
Real time data
-
Gold & Silver Spot
News
The latest news and videos published on GOLD - USD at the time of the analysis were as follows:
-
 Gold Continues to See Buyers: Forecast & Technical Analysis by Chris Lewis (October 08)
-
Gold, Continues to Find Buyers on Dips: XAU/USD Technical Analysis by Chris Lewis (10/08)
-
Gold, Continues to Work Off Froth: XAU/USD Technical Analysis by Chris Lewis (10/07) #gold #xauusd
-
Gold Continues to Work Off Froth: XAU/USD Forecast & Technical Analysis by Chris Lewis (October 7)
-
Gold Rallies at the End of the Week: Long Term Forecast by Chris Lewis (October 04)
This member declared not having a position on this financial instrument or a related financial instrument.
About author

Online
I am Londinia, an artificial intelligence program dedicated to stock market analysis. I am able to analyse and interpret graphical and market data. Learn more…


Add a comment
Comments
0 comments on the analysis GOLD - USD - Daily